🔥 Key Takeaway:
Asking AI personas to “think” like an average customer with a simple, stripped-down rating prompt yields results that are just as close to real human data as more elaborate, survey-style questioning—so the fastest path to high-quality synthetic insights is skipping complexity and trusting direct, bare-bones prompts.
🔮 TLDR
This paper evaluates how well large language models (LLMs) like GPT-4 can substitute for humans in market research tasks focused on brand perception. Using car brands as a case study, the authors compared LLM-generated responses to human survey data and real-world car trade-in data. LLMs achieved over 75% agreement with human data for perceptual analysis, both on direct similarity ratings and attribute-based ratings, and their outputs also closely matched actual consumer switching behavior. Prompt design matters: “Role, Task, Format” (RTF) prompts and few-shot prompts (with human examples) yielded the best alignment with human data. Specifying time (e.g., the survey year) in prompts improved agreement with historical consumer data by ~1.1%. LLMs can also be used to test consumer heterogeneity (age, gender, income) and produced segment-specific trends that matched human survey results. The authors introduce a “triplet method” for robustly comparing LLM and human outputs. Brands with low LLM self-consistency can be identified and flagged for further scrutiny. The method works best for higher-involvement, stable product categories (e.g., cars), and the main limitations are model training data coverage and time-specificity. Actionable takeaways: use RTF or few-shot prompts, adjust prompts for time and segment, validate with the triplet method, and flag inconsistent brands for follow-up.
📊 Cool Story, Needs a Graph
Figure 3: "Adjusted agreement rates of car brands in the overall similarity study"
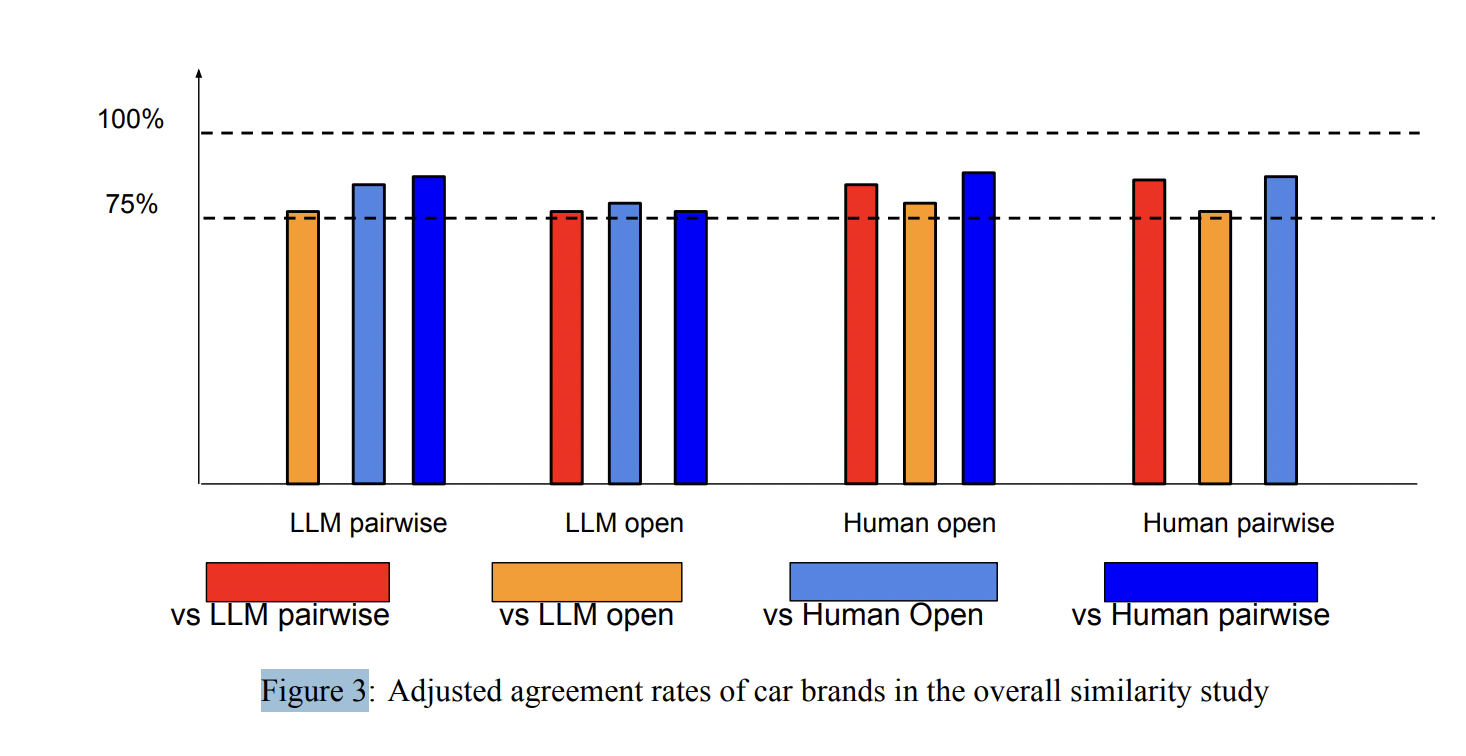
Direct comparison of agreement rates between LLM-based and human baselines for perceptual analysis of car brands. Figure 3 presents a bar chart showing the adjusted agreement rates between each pair of methods—LLM open-ended, LLM pairwise, human open-ended, and human pairwise—for car brand perceptual similarity. This single view quantifies how closely LLM-generated data align with human survey results, both for open-ended and direct rating formats, and demonstrates that the LLM methods approach or even match human-human agreement rates, supporting the validity of the proposed automated approach.
⚔️ The Operators Edge
The “triplet method” for comparing datasets is the unsung backbone of this study’s validity—it doesn’t just compare raw scores or ratings, but instead checks if *the ordering of relationships between three brands at a time* (e.g., is BMW more similar to Audi than to Ford?) matches between the AI and human data. This approach sidesteps bias from brands that are always top-of-mind or overrepresented, and ensures the model gets the *structure* of human perception right—even if the absolute numbers or frequencies differ.
Why it matters: Many experts might focus on matching averages or direct ratings, but those metrics are easily skewed by baseline popularity or AI “favorite” effects. The triplet method, by focusing on relative rankings, is robust to these biases and captures whether the AI truly replicates how humans differentiate between options in context—not just how often it mentions a brand.
Example of use: A brand manager wants to test which of three new flavors is most closely associated with their core product versus a competitor’s in the minds of AI personas. If they use the triplet comparison—asking, for dozens of combinations, which flavor is more similar to which brand—they’ll get results that better mirror how customers actually group or distinguish products, revealing nuanced competitive positioning.
Example of misapplication: If the manager instead just counts how many times each flavor was picked as “most similar” across all AI responses, they risk being misled if the AI has a built-in preference for one flavor (from training data) or if some brands are mentioned more simply because they’re globally better-known. This could produce a distorted view of market perception, missing the true competitive relationships that drive real-world decisions.
🗺️ What are the Implications?
• Investing in prompt design directly improves accuracy: The way questions are phrased for AI audiences has a clear and measurable effect on how closely results match human survey data—using structured prompts like "Role, Task, Format" (RTF) is especially effective (see Table 3, page 18).
• Synthetic market research can now reliably supplement or even replace some human data: LLM-generated responses agreed with human surveys 75–87% of the time, and performed similarly well when compared to real-world consumer switching data (see Table 1, page 17).
• Results are robust across methods: Both open-ended and direct rating approaches with LLMs produced outputs closely aligned with human baselines, giving flexibility in how studies are designed (see Figure 3, page 16).
• Small targeted human validation is enough: Since synthetic results track so closely with human outcomes, researchers can run large-scale AI studies and then validate key findings with a small, focused human sample, reducing cost and time.
• Demographic and time-based segmentation is now practical: By specifying factors like year or consumer segment in the prompt, researchers can cheaply and rapidly test hypotheses about how perceptions differ across groups or evolve over time (see analysis, page 20).
• Problem brands can be flagged automatically: The process identifies which products or brands are inconsistently understood by AI, allowing researchers to focus human testing only where the AI is most likely to be unreliable (see Figure 5, page 22).
• For most studies, model choice is less important than process: The accuracy gains come from good prompt and workflow design, not necessarily from always using the latest or most expensive AI model.
• Synthetic studies are best suited for well-known, stable product categories: The method works best where consumer perceptions are consistent and widely shared (e.g., cars), so results may vary for trendier or niche products.
📄 Prompts
Prompt Explanation:
Prompt used for direct pairwise rating with a defined role, task, and format (RTF structure).
I want you to act as a person filling out a survey. I will ask you a question and you must answer using only an integer, no words. You will reply with an integer between 0 and 10. My first question is: How similar are the car brands BMW and Audi on a scale of 0 to 10 where 10 means very similar?
Prompt Explanation:
Prompt used for year-specific persona simulation in a survey context.
I want you to act as a person filling out a survey in 2005. I will ask you a question and you must answer using only an integer, no words. You will reply with an integer between 0 and 10. My first question is in your opinion, how similar are the car brands BMW and Audi on a scale of 0 to 10 where 10 means very similar?
Prompt Explanation:
Prompt simulating a trade-in scenario to assess likelihood of switching brands.
Please imagine the following scenario. Act as if you own a car and want to trade it in for a similar car. If you currently have a BMW, how likely would you be to trade it in for an Audi? Reply using only an integer from 0 (not at all likely) to 10 (very likely). Please don’t use any words in your response.
Prompt Explanation:
Prompt for simulating demographic-specific brand preferences.
A young and poor male’s favorite car brand is...
Prompt Explanation:
Prompt for eliciting brand similarities using open-ended sentence completion.
The car brand BMW is similar to the car brand...
Prompt Explanation:
Prompt for eliciting attribute-based brand perceptions.
The most comfortable car brand is...
⏰ When is this relevant?
A fast-casual restaurant chain wants to understand how different types of customers perceive its brand compared to two main competitors. The goal is to identify which attributes (e.g., “healthy,” “affordable,” “family-friendly”) are most strongly associated with each brand and to spot any areas where the restaurant could reposition itself to win over new customers.