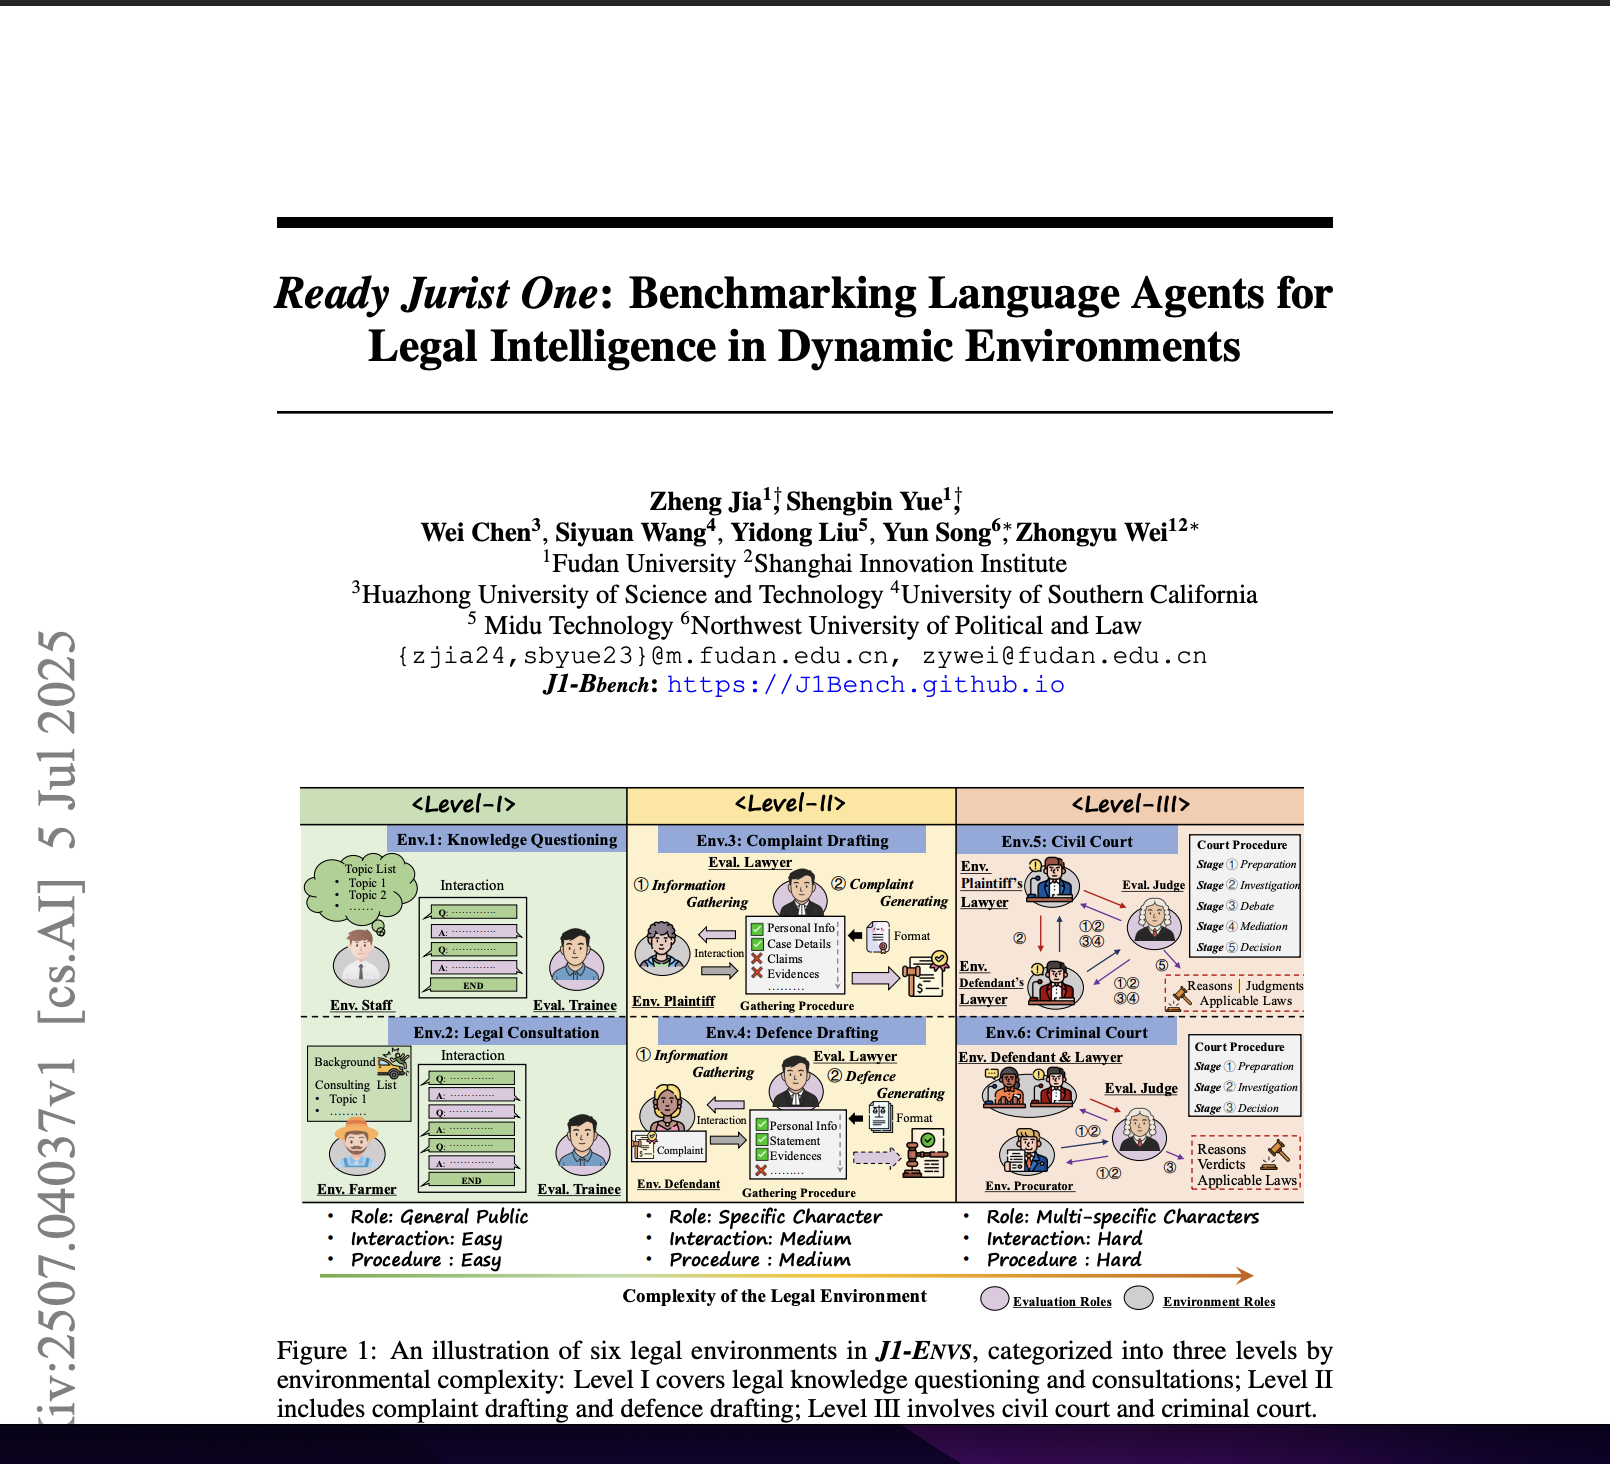
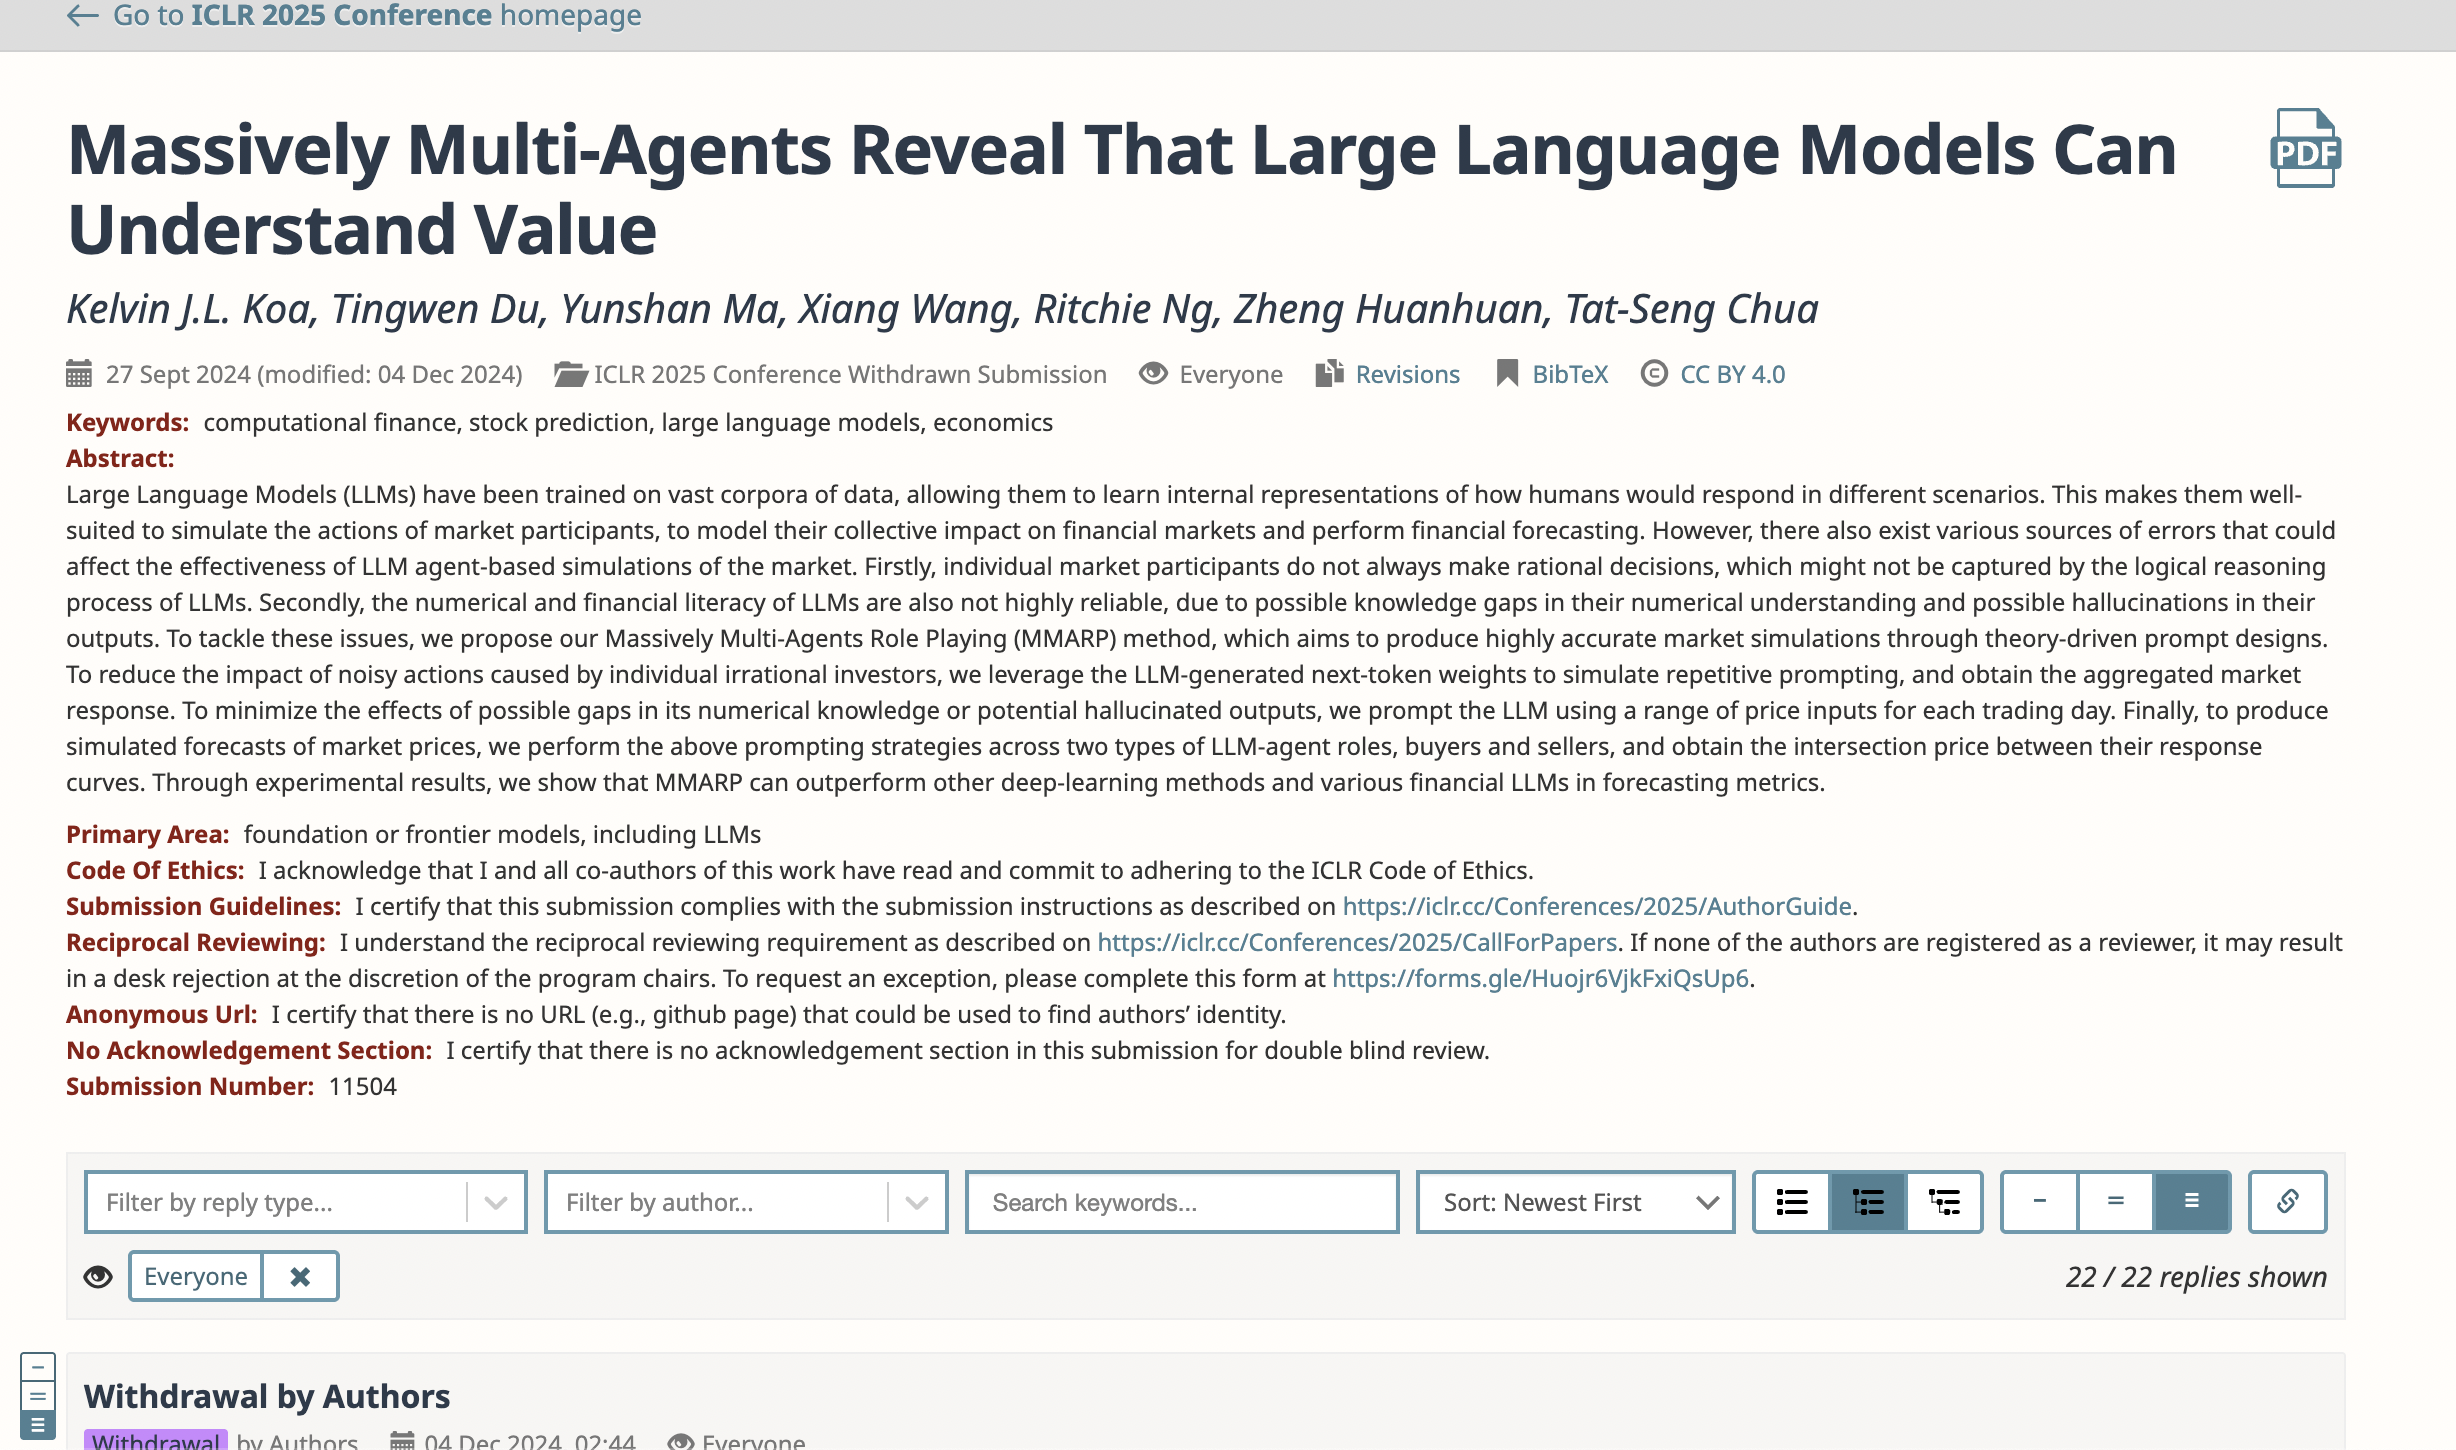
Massively Multi-agents Role Playing: Simulating Financial Market Dynamics with Llms
postAnonymous authors
Published: 2024-09-27
🔥 Key Takeaway:
Rather than forcing each agent into a simple yes/no call, MMARP prompts buyers and sellers over a wide range of price points and uses the LLM’s next-token probabilities to build smooth demand and supply curves. By finding where those curves intersect, you capture the agents’ nuanced willingness to pay or sell—yielding far more accurate, realistic market outcomes than any binary ‘too cheap/too expensive’ framing
🔮 TLDR
This paper introduces MMARP, a framework for simulating financial market dynamics using large numbers of LLM “agents” acting as buyers and sellers. The authors show that LLMs struggle to consistently mimic individual investor irrationality and have notable weaknesses with numerical reasoning, causing noisy or unrealistic outputs if used directly. MMARP addresses these issues by (1) using the LLM’s next-token probabilities (rather than one-off outputs) to aggregate responses and smooth out individual irrationality, (2) prompting the LLM with a wide range of price points to average out errors and hallucinations, and (3) simulating both buyer and seller agent roles, with the intersection of their aggregate response curves used as the market-clearing price. Experiments across stock, currency, and commodity datasets show that MMARP’s simulated demand and supply curves qualitatively match economic theory (e.g., downward-sloping demand, context-sensitive elasticity) and can outperform both direct LLM predictions and traditional deep learning models on trend-correlation metrics (information coefficient), though not always on raw price accuracy (MSE). The authors stress the importance of prompt engineering (extreme binary options for buy/sell), the choice of LLM numerical tokenization, and sufficient sampling across price points for stable results. Key takeaways: aggregate LLM outputs for realism, use many price samples to reduce noise, tune prompts to force clear decisions, and expect better performance on trend/tracking than on exact value prediction.
📊 Cool Story, Needs a Graph
Table 1: "Performance comparisons of MMARP against baselines. (↓) signifies lower is better, while (↑) signifies higher is better. The second-best results are underlined; the best results are boldfaced."
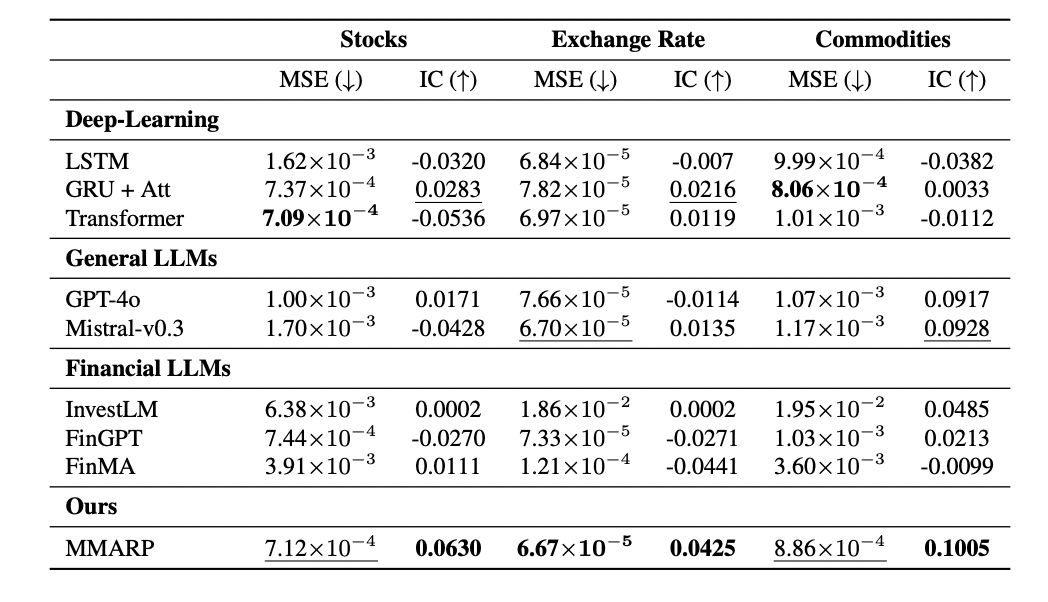
Comparative performance of MMARP and all baselines across stocks, exchange rates, and commodities.
Table 1 provides a side-by-side quantitative comparison of the proposed MMARP method against a broad set of baselines—including LSTM, GRU+Attention, Transformer (deep learning), GPT-4o, Mistral-v0.3 (general LLMs), and three financial LLMs (InvestLM, FinGPT, FinMA)—on both Mean Squared Error (MSE) and Information Coefficient (IC) metrics for three financial domains: stocks, exchange rates, and commodities. The table highlights that MMARP achieves the top IC scores across all domains (bolded values), indicating superior trend-correlation, and competitive MSE, enabling clear assessment of where the method excels or underperforms relative to all established baselines in a single consolidated view.
⚔️ The Operators Edge
A subtle but crucial detail in this study is that the researchers didn’t just generate lots of simulated responses—they specifically leveraged the LLM’s next-token probabilities (the internal “weights” the model assigns to each possible answer) to estimate how a large population would respond, rather than simply sampling random outputs over and over. This approach mathematically mirrors how real-world market demand is formed (through the “law of large numbers”), smoothing out individual irrationality and randomness without needing thousands of explicit persona runs.
Why it matters: Most experts might assume you need to run the LLM hundreds or thousands of times with different random seeds or persona variations to simulate a crowd, but this study shows that you can extract a near-instantaneous ""aggregate"" market response by tapping into the model’s probability distribution for each answer. This not only speeds up the simulation dramatically, but gives a more stable and representative result than brute-force sampling or naive persona generation.
Example of use: Suppose a pricing manager wants to know if a $99 or $149 price point will be seen as “too expensive” by the majority of potential buyers. Instead of running 1,000 separate AI personas and counting votes, they can prompt the LLM with the key scenario and directly read the probability assigned to “Too Expensive” versus “Good Value” for each price. The manager instantly sees, for each price, what percent of the simulated market would reject or accept the offer—mirroring how a real brand might estimate market acceptance curves.
Example of misapplication: A team uses traditional random sampling—having the LLM generate hundreds of long-form persona answers for each scenario—then averages the results, thinking this will give them a realistic market prediction. In reality, this wastes time and compute, and risks being skewed by outlier responses or prompt drift, especially if prompts are inconsistently worded. By overlooking the LLM’s internal probability outputs, they miss out on both efficiency and the more statistically robust aggregate that this study demonstrates is possible.
🗺️ What are the Implications?
• Use many simulated responses, not just one-off answers: The research shows that asking the AI to generate lots of responses and then averaging them gives a much more realistic picture of what a market would do, because it cancels out individual quirks or random errors that a single AI ""persona"" might make.
• Vary the scenarios or prices you test, not just the question wording: Running your experiment across a range of possible prices or offer conditions and looking at the aggregate pattern is more reliable than just asking about one specific scenario. This is especially useful for pricing studies or testing market reactions to new offers.
• Carefully design your survey choices to encourage clear decisions: The study found that using “extreme” answer choices (e.g., “Too Cheap” vs. “Too Expensive”) forced the AI to take a stand, making simulated demand curves and results much more interpretable than using vague or neutral options.
• Don’t worry too much about which AI model you use—as long as you aggregate and design prompts well: The difference between various AI models (like GPT-4, Llama, Mistral) was much less important than how you structured the experiment and the use of multiple samples. This means you don’t need the latest or most expensive model to get good results.
• Expect better accuracy for spotting trends than for predicting exact numbers: The AI method was best at capturing what direction things are moving (e.g., which product will get more interest), but not as strong at guessing the exact level of demand or price. Use it for “which option wins” or “which way the market is shifting,” not for pinpoint forecasts.
• Simulated audiences are robust for comparing different options, not for absolute forecasting: The method worked well for testing which idea or message performs better, which is ideal for A/B testing, concept ranking, or pricing tiers—less so for predicting exactly how many units will sell.
• Run larger, more varied virtual experiments for more stable results: The more price points or conditions you test and the more AI responses you aggregate, the less random noise in the output, so bigger synthetic studies (more “virtual buyers/sellers” and more test cases) give more trustworthy answers.
📄 Prompts
Prompt Explanation: The AI was prompted to assume the role of a market participant (buyer or seller) and respond to whether a given financial asset price is ""Too Expensive"" or ""Too Cheap"" (for buyers) or ""Too Low"" or ""Too Good"" (for sellers), based on provided contextual information and price, in order to simulate market demand and supply responses using next-token probabilities.
You are an investor buying [ASSET] stock. Given a set of news and the current market price, consider if it is too expensive or too cheap.
News: [contextual information]
Price: [relative change from previous Close]
Options: Too Expensive, Too Cheap

(For seller agents)
You are an investor selling [ASSET] stock. Given a set of news and the current market price, consider if the bid price is too low or too good.
News: [contextual information]
Price: [relative change from previous Close]
Options: Too Low, Too Good
⏰ When is this relevant?
A consumer electronics brand wants to test how target customers would react to three different price points for a new wireless smart speaker, using AI personas to estimate "willingness to buy" and surface objections or motivators. The goal is to quickly understand which price point is most attractive and why, before running a real-world pricing test.
🔢 Follow the Instructions:
1. Define audience personas: Identify 3–5 realistic customer profiles relevant to your brand, such as ""Tech-savvy urban professional,"" ""Budget-focused college student,"" and ""Home-focused parent."" For each, write a short description including age, lifestyle, shopping priorities, and attitudes toward technology.
2. Prepare the pricing concept prompt: Draft a short, consistent description of the product and each price point. Example:
Product: ""The EchoMax is a wireless smart speaker with high-fidelity sound, voice assistant, and multi-room support.""
Price Points: $49, $99, $149.
3. Create the persona prompt template: Use the following structure to ensure clear, consistent responses:
You are simulating a [persona description].
The product you are considering is: ""[Product description]""
The price is: $[insert price point]
Would you buy this product at this price? Why or why not? Respond as your persona would, in 2–4 sentences.
Choose only one: ""Too Expensive"" or ""Good Value"".
4. Run the simulation for each price point and persona: For each persona, input the prompt at each price point (e.g., $49, $99, $149). For more robust results, generate 10–20 responses per persona/price by rewording slightly or varying the AI’s randomness.
5. Aggregate the responses: For each persona and price, count how many chose ""Too Expensive"" vs. ""Good Value,"" and note any recurring reasons or objections from the open-ended answers.
6. Chart and compare results: Create a simple table or chart showing, for each persona, at which price point ""Good Value"" peaked and what reasons were given. Highlight patterns, such as ""Tech-savvy professionals prefer $99, citing features; budget students only choose $49.""
7. Summarize pricing insights: Write a brief summary for stakeholders, noting the most attractive price points for each segment, key motivators (e.g., sound quality, brand, price), and most common objections (e.g., too expensive for students, missing feature for parents).
🤔 What should I expect?
You'll get a clear, data-driven sense of which price points resonate most with your target audiences, why certain groups object or are motivated, and actionable guidance on which price(s) to prioritize for launch or further real-world testing—without having to run a live customer survey or focus group.