Performance and Biases of Large Language Models in Public Opinion Simulation
postYao Qu, Jue Wang
Published: 2024-08-28
🔥 Key Takeaway:
The harder you try to make your synthetic audience look "global" or "diverse" by piling on demographic details, the more your results will drift away from real-world opinions—because current AI models still default to the dominant voices in their training data, so adding more attributes just amplifies bias instead of fixing it.
🔮 TLDR
This study tested ChatGPT’s ability to simulate public opinion across six countries using World Values Survey data, finding that its accuracy is significantly higher in Western, English-speaking, developed countries (e.g., USA mean Cohen’s Kappa 0.239) and much lower elsewhere (e.g., Japan 0.024, South Africa 0.006). The model’s simulated responses also exhibited demographic biases: it more closely matched groups that are male, white, older, highly educated, or upper/middle class, and underrepresented others. Political simulations were more accurate than environmental ones (Kappa 0.306 vs 0.270), but the model’s ideological bias varied by topic—showing a 16.3% overrepresentation of liberal choices in political questions, but a 6.1% underrepresentation in environmental ones. The accuracy of simulated results dropped sharply as the number of response options increased (from 65.9% agreement for binary to 29.2% for four-choice), indicating that complex survey structures make AI simulation less reliable. The main actionable points are: be aware of strong culture, language, and demographic biases in LLM-based simulations; keep response sets simple for better fidelity; and consider topic-specific ideological drift in outputs. To improve real-world accuracy, diversify training data, represent more global and minority perspectives, and use multiple covariates where possible.
📊 Cool Story, Needs a Graph
Figure 2: "ChatGPT simulation accuracy by country"
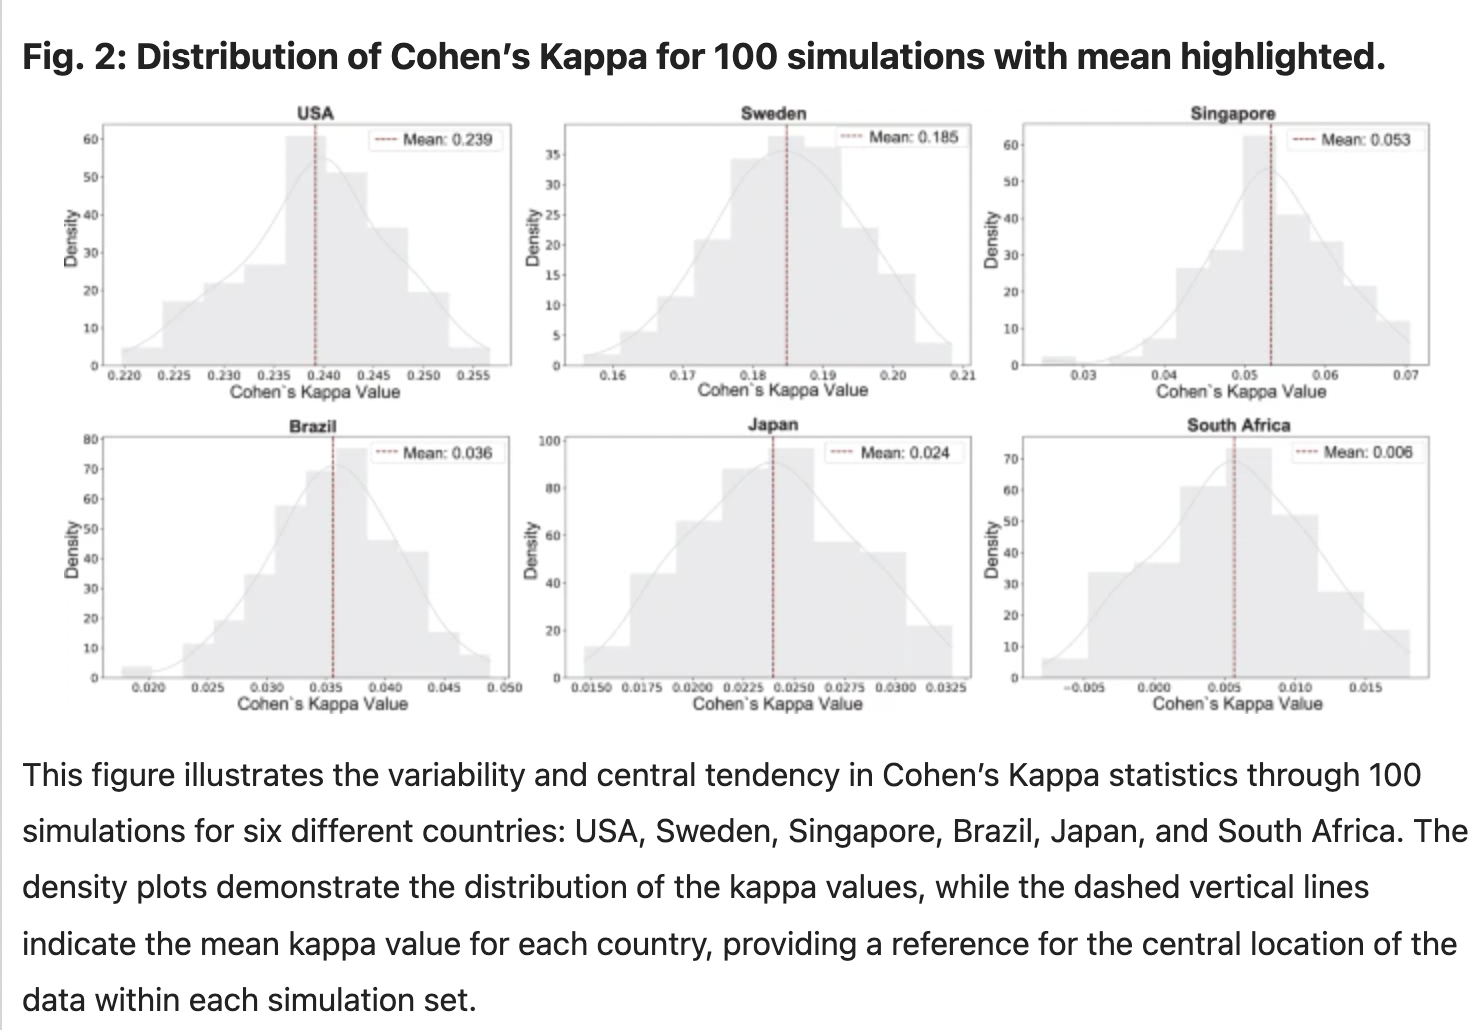
Comparison of ChatGPT’s simulation accuracy across six countries, showing clear performance gaps by region.
Figure 2 presents density plots of Cohen’s Kappa values for 100 simulation runs in each of six countries—USA, Sweden, Singapore, Brazil, Japan, and South Africa—with each subplot showing the full distribution and the mean marked by a dashed line. This side-by-side visualization makes it easy to see that ChatGPT’s alignment with real survey data is much stronger in Western, English-speaking, developed countries (with the USA and Sweden showing higher mean scores) and substantially weaker in developing or non-English-speaking contexts (Japan and South Africa have very low means). This figure offers a direct, visual baseline comparison of the model’s performance in different environments, highlighting systematic disparities.
⚔️ The Operators Edge
A detail that most experts might overlook is that this study didn’t just run a few simulations for each AI persona—it ran 100 separate simulations per respondent and then averaged the results for every prompt. This approach wasn’t just to “smooth out” randomness; it specifically targeted the known variability in LLM outputs, ensuring that any one-off weird answer or outlier didn’t unduly influence the population-level findings. By taking the mean of many runs, the authors made their synthetic results more stable, representative, and resistant to the quirks of stochastic language model sampling.
Why it matters: This detail is crucial because large language models are inherently non-deterministic—ask the same question twice, and you might get subtly (or sometimes wildly) different answers. Sampling many times and averaging isn’t just a technical nicety; it’s a practical safeguard that turns noisy, inconsistent AI outputs into reliable market signals. It’s the difference between replicating real-world population distributions and being misled by a single “hallucinated” response.
Example of use: Suppose a company wants to estimate likely customer reactions to new ad copy using synthetic personas. Instead of running the prompt once per persona and believing the answer, they should sample the model 20–100 times for each scenario, then analyze the average tone, key themes, or choices. This produces a result that’s robust enough to guide messaging strategy—reflecting the “center of gravity” of possible audience responses.
Example of misapplication: A team uses AI personas to simulate how different demographics would vote on a controversial policy. They run each prompt once, take the result at face value, and declare “majority support” based on that single output. Because LLMs are stochastic, this can yield results that swing with prompt order, temperature, or random seed—so their finding might be a fluke. Without repeated sampling and averaging, they risk making strategic decisions based on outliers or model noise, not true synthetic consensus.
🗺️ What are the Implications?
• Expect better results when simulating Western, English-speaking or highly developed markets: The model was much more accurate in the US and Sweden compared to Japan, Brazil, or South Africa, so simulations will be more reliable for audiences who match the model’s training data.
• Keep answer choices simple and focused: Simulation accuracy dropped sharply when more response options were added (e.g., 66.8% agreement for two options vs. 29.2% for four options), so stick to binary or limited-choice designs where possible.
• Recognize and check for demographic and ideological bias: The model tended to match higher-educated, upper/middle class, older, and white/male groups best, and showed topic-dependent political skew (e.g., 16% more liberal in political questions, 6% less in environmental), so always review outputs for over- or under-representation of key segments.
• Add more real-world diversity where you can: Results were weaker for non-Western and minority groups—so supplement synthetic studies with targeted human sampling, or enrich your virtual audience with additional context and traits to better reflect your actual target market.
• Use multiple demographic and behavioral inputs (covariates): Simulations that included several relevant factors (not just age/gender) produced more credible results, so include as much real segmentation and behavior data as possible in your virtual personas.
• Validate findings with small-scale real-world checks: Since AI simulations can systematically miss certain groups or exaggerate differences, spot-check key results with a limited number of real interviews or surveys before making big decisions.
• Don’t assume “country” context is always well modeled: The model’s responses were sensitive to country prompts but only accurate for countries well represented in its training data—be cautious when simulating less familiar or emerging markets.
📄 Prompts
Prompt Explanation: The AI was instructed to simulate a human respondent with specific demographics answering a survey question about prioritizing the environment versus economic growth.
Please assume that you are a 30-year-old female with a university degree and middleclass status. When asked whether you support protecting the environment or enhancing economic growth, what is your choice: (1) emphasis on protecting the environment, (2) emphasis on economic growth, or (3) neither/other?
Prompt Explanation: The AI was prompted in native languages using localized demographic profiles to simulate respondents from non-English speaking countries.
Assume the persona of a 45-year-old male from Brazil with high school education and working-class background. Responda à seguinte pergunta: você apoia mais a proteção ambiental ou o crescimento econômico? (1) ênfase na proteção ambiental, (2) ênfase no crescimento econômico, ou (3) nenhum/diferente?
Prompt Explanation: The AI was guided to simulate a respondent’s political voting intention based on demographic data.
Assuming you are a 40-year-old male, white, with a college degree and middle class in the United States, which party would you vote for if there were a national election tomorrow? (1) Democrat, (2) Republican, (3) Other party, (4) No answer/Don’t know/I would not vote.
Prompt Explanation: The AI was directed to provide a reasoning chain before delivering its survey answer to mimic human-like thinking.
Please assume you are a 50-year-old female, Black, with no formal education and lower class status. When asked if you would prioritize environmental protection or economic growth, what is your answer? Provide a brief reasoning chain before your final answer. (1) Emphasis on protecting the environment, (2) Emphasis on economic growth, or (3) Neither/Other?⏰ When is this relevant?
A consumer bank wants to understand how different customer segments would react to a new digital savings product designed for young professionals, mid-career parents, and retirees. The team wants to use AI personas to simulate survey responses and identify which features or messages are most appealing for each segment.
🔢 Follow the Instructions:
1. Define audience segments: Create three AI persona profiles representing: (a) a 28-year-old urban professional focused on convenience and growth, (b) a 42-year-old parent with two kids, concerned about family security and educational expenses, and (c) a 67-year-old retiree interested in stability and ease of access.
2. Prepare prompt template: Use the following format for each persona:
You are simulating a [persona description].
Here is the new savings product being tested: ""A digital account with 2.5% interest, no monthly fees, instant transfers, and options to set savings goals.""
You are being surveyed by a bank researcher.
Respond naturally and honestly as this persona, using 3–5 sentences.
First question: What is your first reaction to this new savings account? What do you like or dislike about it?
3. Run the prompt for each persona: Input the prompt into your preferred language model (e.g., ChatGPT or GPT-4), running 5–10 simulations per persona to capture a range of possible responses.
4. Add simple follow-up prompts: Based on the initial answers, ask a relevant follow-up question such as: ""Would this account make you consider switching from your current bank? Why or why not?"" Generate a few responses for each persona.
5. Tag and summarize the results: Review all responses and tag themes such as ""mentions digital convenience,"" ""interest in interest rate,"" ""concern about security,"" or ""indifference to new features."" Note sentiment (positive, neutral, negative) for each.
6. Compare across segments: Summarize which features or messages got the best reactions in each segment and where objections or indifference appeared. Identify patterns, such as younger users prioritizing app usability, while retirees emphasize security.
🤔 What should I expect?
You’ll get a quick, directional understanding of which audience segments are most likely to respond well to the new product, what features or language drive their interest, and which objections or barriers are most common. This helps prioritize marketing messages and future product tweaks before committing to large-scale campaigns or customer research.<br>