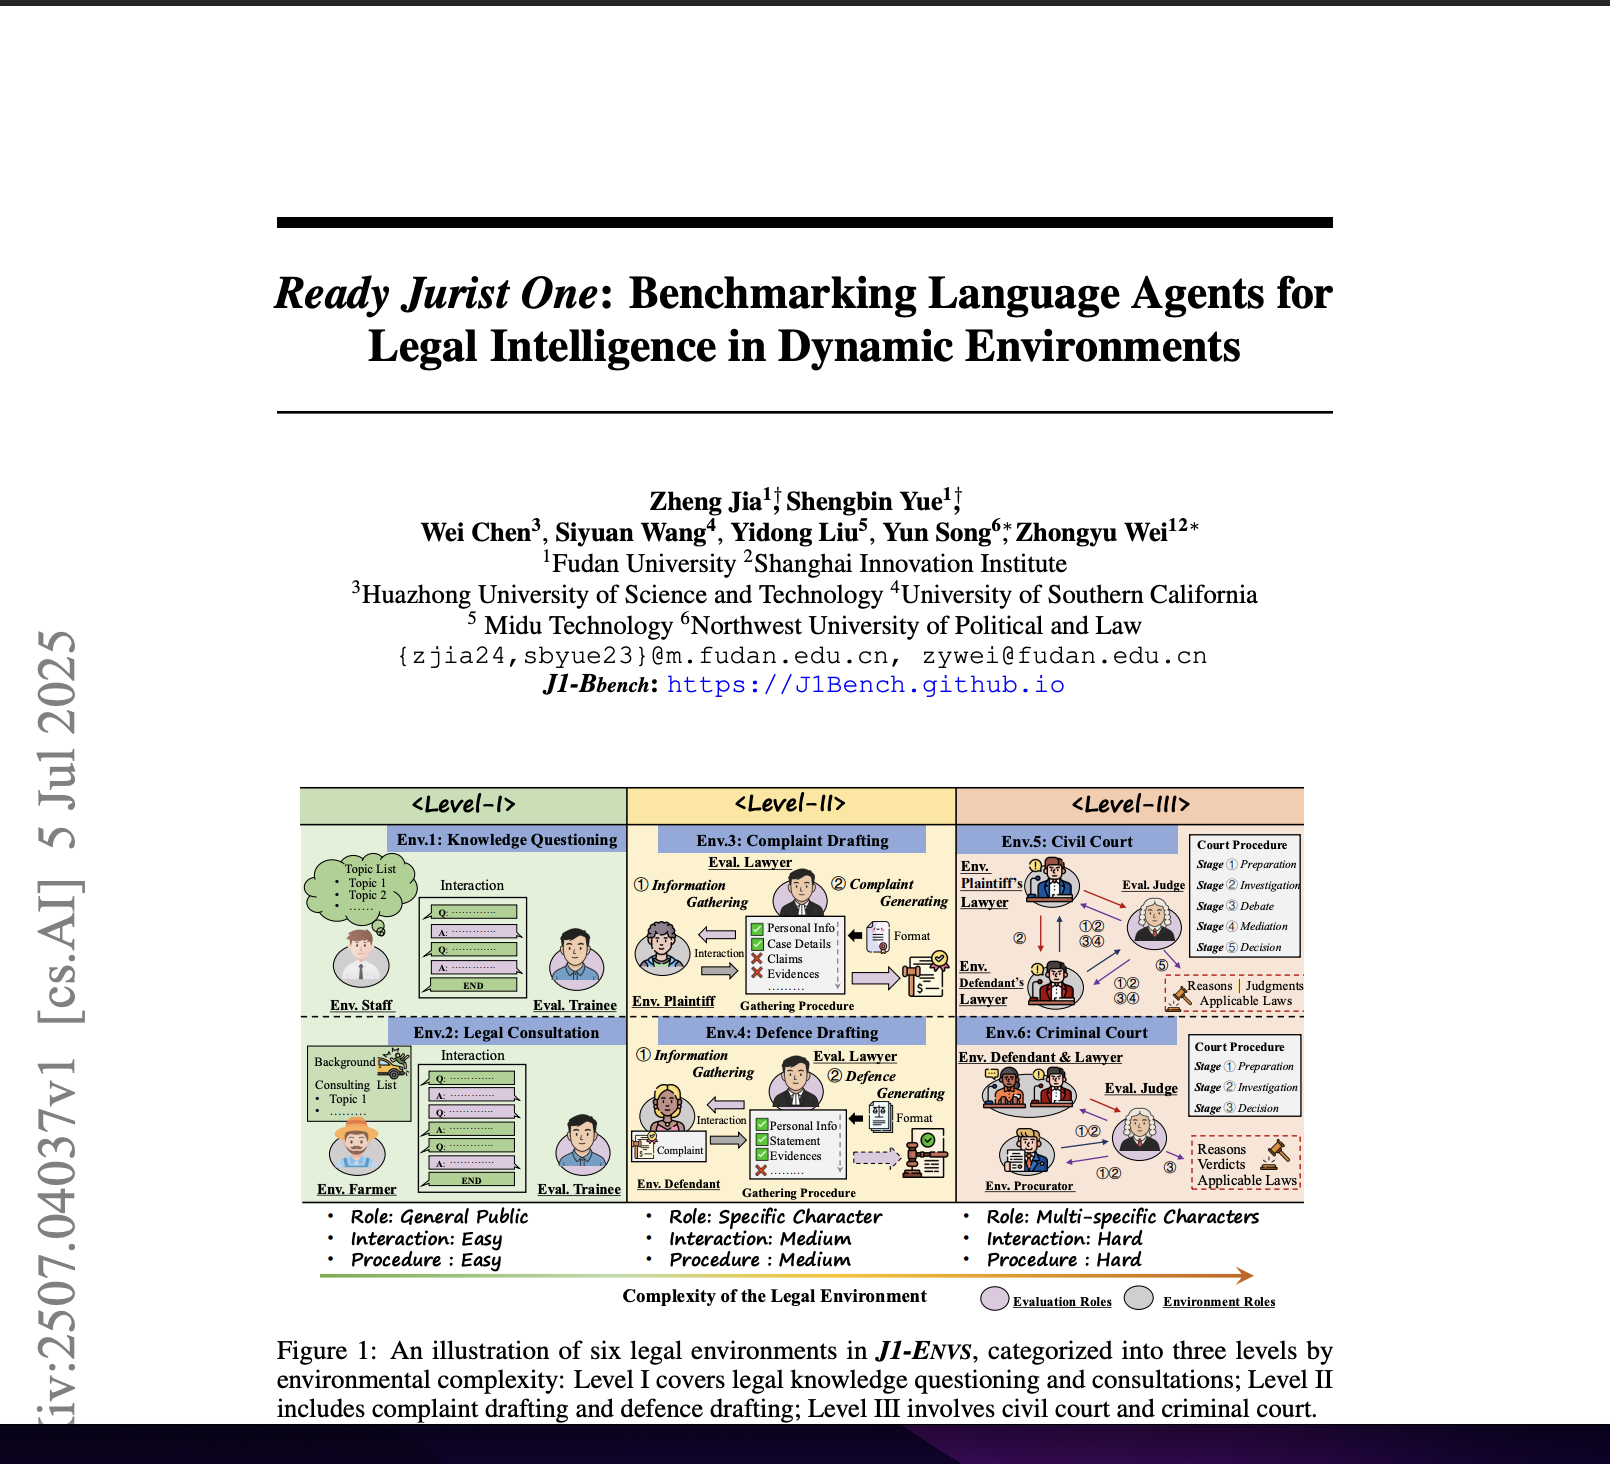
RetailSynth: Synthetic Data Generation for Retail AI Systems Evaluation
postYu Xia, Ali Arian, Sriram Narayanamoorthy, Joshua Mabry
Published: 2023-12-21
🔥 Key Takeaway:
The more faithfully you copy “real-world” customer data into your AI personas, the less realistic your simulation can become—because by ignoring the quirks, randomness, and unexpected cross-category behaviors that happen in real life, you end up creating synthetic customers who are more predictable and less surprising than actual humans.
🔮 TLDR
This paper presents RetailSynth, a synthetic data generator for simulating customer shopping behavior in retail, with a focus on price sensitivity, promotions, and product recommendations. The system uses a four-stage decision model (store visit, category choice, product choice, purchase quantity) calibrated against a large real-world grocery dataset. RetailSynth can simulate the impact of different pricing and promotion policies on revenue, customer retention, and category penetration, and captures heterogeneous responses—such as varying price sensitivities—across customer segments. However, it does not model product bundling or cross-category effects (e.g., people buying pasta and sauce together), which means basket composition may be less realistic for scenarios where such dependencies matter. The tool is validated using statistical tests that show close alignment with real purchase probabilities and sales volumes, though it under-represents extreme behaviors and very large or very small baskets. Actionable insights: (1) using multi-stage choice models calibrated on real data improves realism in synthetic market simulations, (2) modeling customer- and product-level heterogeneity is essential for testing personalization strategies, (3) omitting cross-category dependencies limits simulation realism for certain retail settings, and (4) synthetic simulators like RetailSynth are effective for benchmarking algorithms and experimenting with pricing/promotion strategies when real data is unavailable.
📊 Cool Story, Needs a Graph
Figure 6: "Synthesizer calibration results”
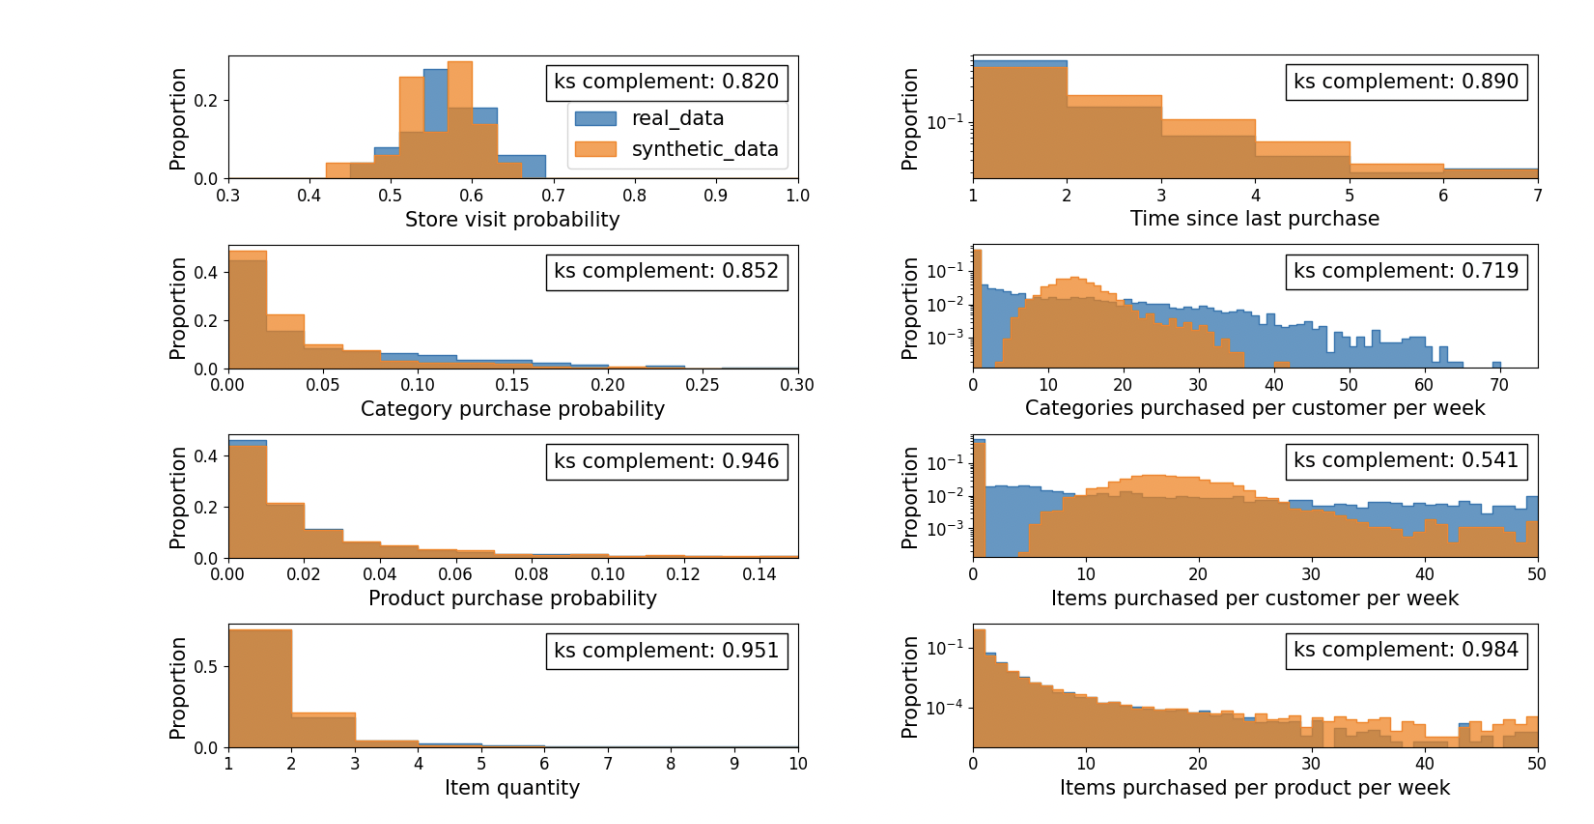
This figure displays side-by-side histogram comparisons of real versus synthetic data distributions for eight key shopper behavior metrics, including store visit probability, category/product purchase probabilities, item quantity, recency, and weekly purchase volumes. Each plot includes a Kolmogorov–Smirnov (KS) complement score, quantifying similarity between distributions—most exceed 0.8, indicating high fidelity, except for two outliers (0.719 and 0.541) where the synthetic model diverges more. This visual provides strong evidence of how well the simulator mimics real consumer patterns, validating its use for experimentation.
⚔️ The Operators Edge
A subtle but crucial detail in this study is the way customer price sensitivity is modeled as a *multiplicative latent factor*—meaning each shopper’s response to price is the product of both a customer-specific and a product-specific parameter (see page 14, Equation 18). This structure turns out to be a hidden lever for generating realistic heterogeneity: it allows the simulator to easily produce some customers who are hypersensitive to price (but only for certain items), and others who ignore price unless it’s a specific brand or category, mirroring real consumer quirks without needing huge, detailed datasets.
Why it matters: Most experts would focus on the realism of the demand curves or overall fit to historical data, but the real reason the simulation holds up is that this multiplicative factorization lets you dial up or down individual or item-level price responses independently. This flexibility is what enables the simulator to produce complex, non-obvious patterns—like a loyal shopper who only responds to deep discounts on snacks but ignores them for produce—making downstream scenario analysis and policy testing far more robust and nuanced.
Example of use: A retailer wants to test personalized coupon strategies before launching. By using a multiplicative latent factor model, they can simulate how different segments (e.g., organic shoppers vs. bulk buyers) react to targeted discounts on different product classes. This helps them spot which combinations of customer and item are most likely to yield incremental sales, and avoid over-discounting where it won’t move the needle.
Example of misapplication: If an analyst instead uses a simple, additive or uniform price sensitivity for all shoppers (e.g., everyone is equally price-sensitive across all products), the simulation will miss key real-world effects—like a customer who is price-blind for coffee but extremely sensitive for cereal. The result: the business might launch a “one-size-fits-all” discount program and see disappointing results, because the model masked the very heterogeneity that drives promotional ROI.
🗺️ What are the Implications?
• Base your synthetic audience on real transaction or behavioral data when possible: The closer your simulated personas match real-world buying patterns (e.g., from actual retail datasets or surveys), the more trustworthy your scenario testing and market predictions will be.
• Include customer and product diversity in your simulations: Don’t treat all personas or products the same—model differences in price sensitivity, purchase frequency, and preferences to test how various segments might react differently to changes in pricing or marketing.
• Test personalization strategies before deploying them in market: Simulated audiences can reveal where targeted offers, discounts, or recommendations would drive the most value, since not all customers respond equally to the same tactics.
• Be aware of what your simulation omits: If your synthetic model doesn’t capture cross-category purchasing or product bundling (e.g., buying pasta and sauce together), expect that basket size and product combinations may be less accurate—this matters most for businesses where such behavior is key.
• Validate your simulation by comparing to known benchmarks: Check that overall sales, retention rates, and other key metrics in your synthetic data align with established norms or historical data; significant mismatches are a sign to revisit your model assumptions.
• Use scenario analysis to explore trade-offs: Simulations can help forecast the impact of different pricing or promotion strategies on both growth and profitability, revealing when a tactic will “buy” more customers but at the cost of reduced revenue per sale.
• Segment your results for actionable insights: Always analyze how different customer types (e.g., more or less price sensitive) respond to changes—this helps avoid “one size fits all” conclusions and allows for more targeted, cost-effective interventions.
⏰ When is this relevant?
A grocery retailer wants to experiment with different discount strategies for a new line of healthy snacks and understand how three types of customers—price-sensitive deal hunters, health-focused shoppers, and busy parents—might react to various promotional offers. The company will use AI personas to simulate shopper reactions, aiming to decide which discount approach is likely to drive the most engagement and sales.
🔢 Follow the Instructions:
Write short descriptions for each segment. For example:
• Price-sensitive deal hunter: 35, prefers sales, tracks weekly flyers, shops for best value.
• Health-focused shopper: 29, reads nutrition labels, avoids processed snacks, willing to pay more for quality.
• Busy parent: 42, two school-age children, wants quick and easy snacks, shops on tight schedule.
2. Prepare prompt template for AI personas: Use this template to guide each simulation:
You are simulating a [persona description].
You just saw a new healthy snack on the shelf at your usual grocery store. There is a promotion: [insert discount scenario, e.g., “10% off single packs,” “Buy one get one free,” or “20% off with loyalty card”].
In 2–4 sentences, explain how you would react as this shopper—would you notice the deal, would it influence your purchase, and what factors would matter most to you?
3. Run the simulation for each promotion and persona: For each shopper type, generate 5–10 AI responses per promotional scenario (mix the three discount types). Use slight variations in the prompt wording to mimic different customer moods or shopping trips.
4. Collect and tag responses: Review the AI answers and tag common themes such as “responds to savings,” “mentions health benefits,” “concerned about convenience,” or “indifferent to deal.”
5. Compare results across segments and promotions: Summarize which discount offers triggered the most positive reactions in each group, which messaging points were most often mentioned, and where resistance or indifference appeared.
6. Draft key recommendations: Write a simple summary for business stakeholders: which discount to prioritize for which segment, any messaging changes needed, and where deeper testing with real customers is warranted.
🤔 What should I expect?
You’ll get rapid, segment-specific insights into which types of discounts are most likely to motivate different customer groups, what objections or motivators arise, and practical guidance on how to tailor promotions and messaging for a real-world pilot—without running a costly live experiment up front.<br>