🔥 Key Takeaway:
The secret to getting AI audiences to outperform even expert humans isn’t more “AI magic”—it’s feeding them the same messy, biased, real-world human answers and demographic quirks you’d use for training people, because AI only gets smart when you prime it with our own imperfect history.
🔮 TLDR
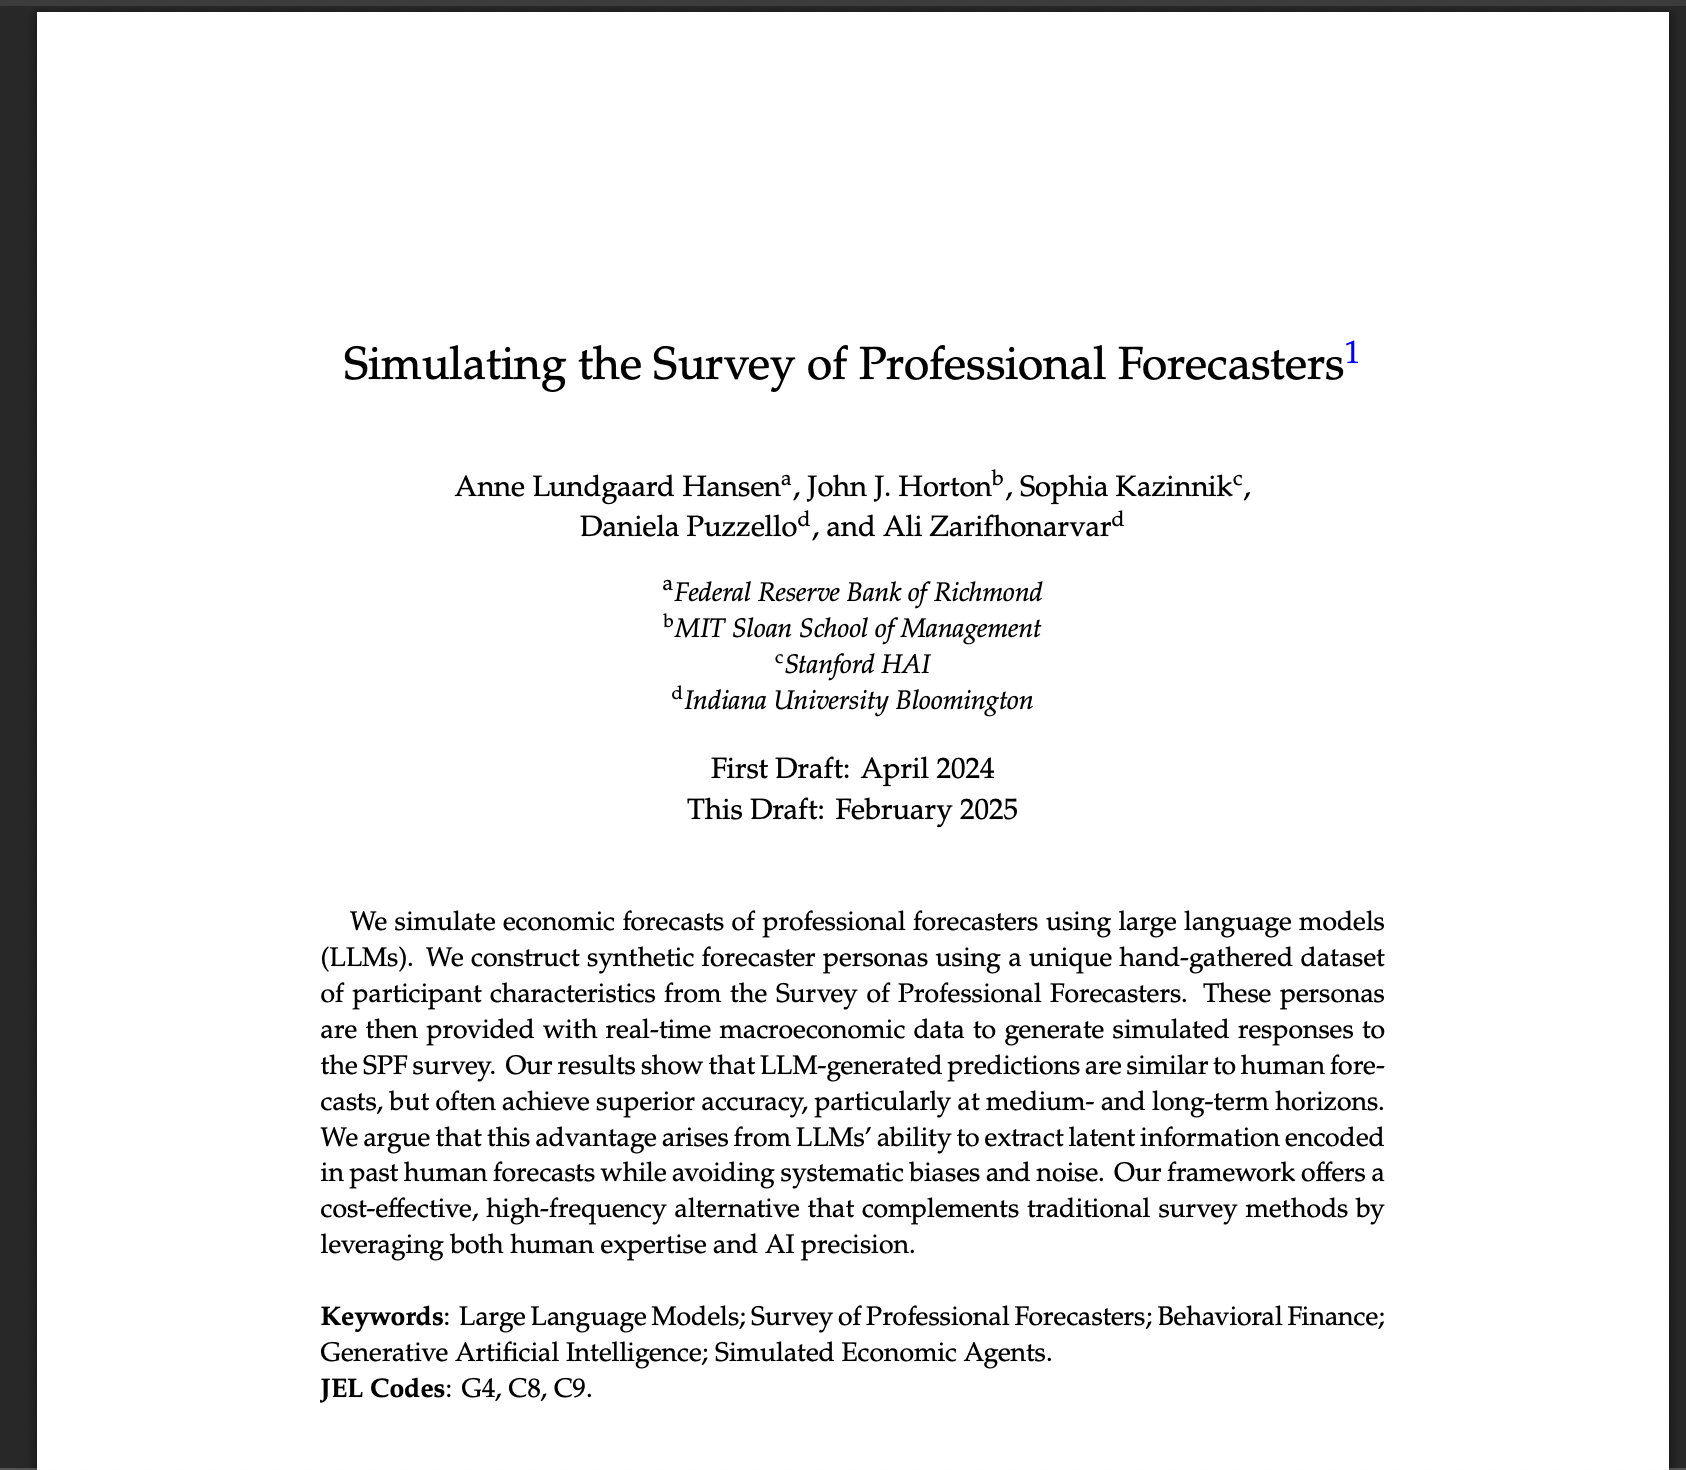
This paper shows that large language models (LLMs) can be used to create synthetic personas that simulate professional forecasters, and these AI-generated forecasts are usually as accurate—or often more accurate—than human experts, especially for medium- and long-range predictions. The researchers built AI personas using detailed real-world data (education, job titles, organizations, etc.) and gave them the same real-time macroeconomic data and historical forecasts as human panelists. Adding these real-world details, past human responses, and up-to-date data to the LLM’s prompt was critical: removing any of these inputs led to sharp drops in accuracy (for example, omitting past human forecasts increased errors by 53–757%). The study also tested robustness across different LLM models and prompt styles, finding similar results. A key takeaway is that combining LLMs with structured, context-rich persona data and human-generated historical responses can produce synthetic survey results that closely mirror—and sometimes outperform—actual human panels. This method offers a cost-effective and rapid alternative for market research, but its accuracy depends on including both detailed persona characteristics and access to real or recent crowd data.
📊 Cool Story, Needs a Graph
Figure 6: "SPF and AI-generated median forecasts"
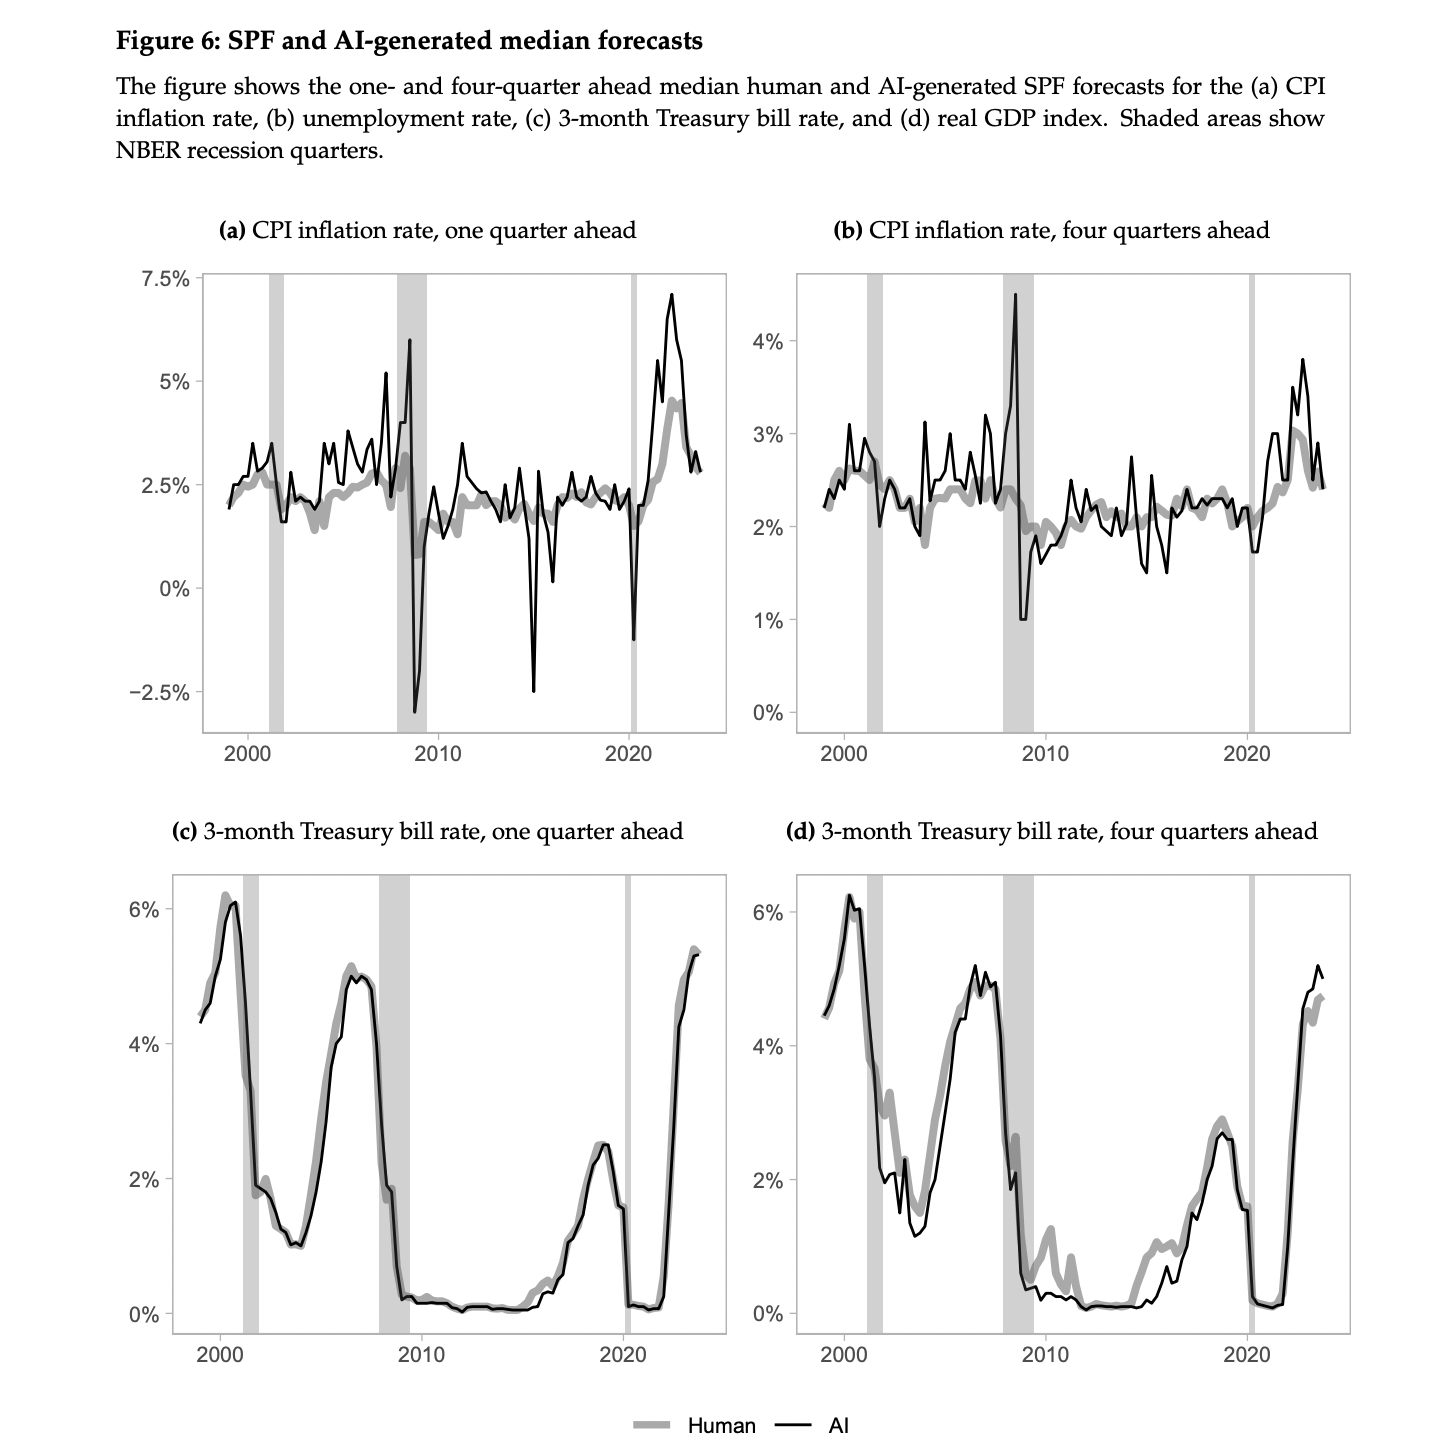
AI forecasts track human medians closely over time but show sharper business-cycle responsiveness.
This figure compares the median forecasts made by human experts and AI models for the CPI inflation rate, 3-month Treasury bill rate, unemployment rate, and real GDP index, across one- and four-quarter horizons. Each subplot shows the forecast time series over multiple decades, with recession periods shaded. The figure illustrates strong alignment between human and AI forecasts, while also highlighting where AI reacts more sharply to macroeconomic shifts, particularly for inflation and interest rates during turning points like the 2008 crisis and COVID-19 downturn. It provides a visually comprehensive benchmark for how closely the AI simulates human panel behavior across diverse indicators.
⚔️ The Operators Edge
One subtle but critical detail in this study is that *including the actual past median forecasts from human experts as a context input*—not just demographic details or real-time data—was the biggest driver of AI accuracy and realism. The results (see Table 8, page 45) showed that removing these historical crowd answers caused error rates to skyrocket, sometimes increasing forecast errors by more than 700%, far more than omitting even detailed persona traits.
Why it matters: Most experts assume that feeding AI personas more demographic or psychographic detail is what makes them act “more human.” But here, what really made the AI personas smart and realistic was giving them direct access to how real humans had answered previously—essentially letting the AI “see” and adapt to the patterns, biases, and knowledge embedded in the actual historic crowd, not just theoretical data or model knowledge. This means the magic isn’t in the persona story or the model, but in the quality and recency of the crowd signals you use.
Example of use: Imagine a company launching a new consumer product. Before running a synthetic A/B test with AI personas, they first collect last year’s customer survey responses and key purchasing trends, then feed those aggregate results (e.g., “last year, 32% of shoppers preferred feature X, and 21% cited price as a concern”) as part of the context for each AI persona. This anchors the simulated audience in real buying patterns and objections, making the resulting feedback far more predictive of market response.
Example of misapplication: A team builds a synthetic customer focus group but skips historical context, relying on only market segment labels (“urban millennial,” “rural retiree,” etc.) and current product info. The AI personas then generate plausible-sounding but generic answers, missing real-world quirks, biases, and shifts that the actual market showed (such as a sudden aversion to subscription fees or new enthusiasm for eco-friendly packaging after a news event). As a result, product messaging or pricing is set based on incomplete signals, and the launch underperforms because the synthetic crowd failed to reflect the most powerful, recent market dynamics.
🗺️ What are the Implications?
• Include real, recent crowd or market data in your simulations: The study shows that providing AI personas with up-to-date, real-world data (such as recent survey results or market trends) dramatically improves the accuracy of simulated audience responses, while omitting these inputs can increase errors by over 50%, making real data a must-have for credible outputs.
• Build detailed, relevant personas, not just generic agents: Adding attributes like job role, education, company, and even social media presence to your AI personas yields more realistic and predictive answers than simply using ""average"" or randomly generated profiles.
• Don’t skip the historical context—use past human responses: When AI personas are seeded with actual historical survey answers, their predictions improve sharply; removing this context led to error increases as high as 757% in some forecasts, so always leverage prior wave or legacy data when available.
• Avoid stripping away inputs for convenience—accuracy suffers quickly: The research found that every shortcut (like skipping persona details, omitting current data, or ignoring past responses) led to a measurable and often large drop in simulation accuracy. For business-critical studies, invest in well-constructed, context-rich prompts.
• Validate with simple A/B tests or spot checks: Even the best AI simulations can drift if key context is missing. Running a quick human spot-check or A/B with a real sample can catch mistakes before they impact business decisions.
• Hybrid human+AI approaches are the new gold standard: The best results came from combining AI with structured human input—use synthetic studies for rapid, scalable insight, but ground findings with periodic human validation or mixed-method analysis for maximum credibility.
📄 Prompts
Prompt Explanation: The AI was prompted to simulate the role of a professional forecaster in the SPF panel, using personalized demographic data, real-time macroeconomic indicators, and past median forecasts to produce economic predictions for multiple future horizons, including brief justifications.
You are a professional forecaster participating in the Survey of Professional Forecasters (SPF) as of {quarter_year}. Your background is as follows:
- Education: {degree}, {field}
- Position: {job_title} at {organization} ({organization_type})
- Experience: graduated in {graduation_year}
- Location: {location}
- Public engagement: {media_presence}

Please forecast the following U.S. economic indicators for the current quarter and the next four quarters:

1. Real GDP (annual rate, 2010 base)
2. CPI inflation rate (annual rate)
3. Civilian unemployment rate (percentage)
4. 3-month Treasury bill rate (percentage)

Use the provided real-time macroeconomic data up to {quarter\_year} and median SPF forecasts from the previous quarter. Your output should be formatted as follows:

* Quarter {t}: \[Value 1], \[Value 2], \[Value 3], \[Value 4]
* Quarter {t+1}: ...
* ...
  Include a brief (1-2 sentence) explanation after the forecasts describing your reasoning.

IMPORTANT: Do not use any information beyond {quarter\_year}. Your responses should reflect only what is known up to this point in time.
Prompt Explanation: The AI was instructed to simulate a forecast without including personal forecaster characteristics, relying instead on real-time data and historical SPF medians.
You are a generic forecaster in the Survey of Professional Forecasters (SPF) for the quarter {quarter_year}.

Your task is to provide economic forecasts using only the following inputs:

* Real-time macroeconomic data available up to {quarter\_year}
* Past median SPF forecasts

Please forecast the following indicators for the current and next four quarters:

1. Real GDP (annual rate, 2010 base)
2. CPI inflation rate (annual rate)
3. Civilian unemployment rate (percentage)
4. 3-month Treasury bill rate (percentage)

List your forecasts in the following format:

* Quarter {t}: \[Value 1], \[Value 2], \[Value 3], \[Value 4]
* Quarter {t+1}: ...
* ...
  Do not incorporate any forecaster-specific traits. Add a short explanation (1–2 sentences) justifying your forecasts based on the available data.
Prompt Explanation: The AI was directed to simulate forecasts using only past SPF median forecasts and pre-trained knowledge, omitting real-time macroeconomic data.
You are participating in the SPF for {quarter_year}.

Please produce economic forecasts for the following U.S. indicators over the next five quarters:

1. Real GDP (annual rate)
2. CPI inflation rate (annual rate)
3. Unemployment rate (percent)
4. 3-month Treasury bill rate (percent)

Use only:

* Past SPF median forecasts
* Your general economic knowledge up to {quarter\_year}

DO NOT use real-time macroeconomic data. Base your predictions solely on previously published median forecasts and economic patterns learned during training. Format your forecast output as follows:

* Quarter {t}: ...
  Include a short explanation.
Prompt Explanation: The AI was instructed to produce forecasts relying exclusively on its internal training data, without access to real-time data or historical SPF forecasts.
You are simulating a professional forecaster for {quarter_year}.

Your task is to forecast the following for the current and next four quarters:

1. Real GDP
2. CPI inflation rate
3. Unemployment rate
4. 3-month Treasury bill rate

You have NO ACCESS to:

* Real-time macroeconomic data
* Past SPF forecasts
* Forecaster-specific traits

Use only your general knowledge and reasoning. Provide a forecast for each quarter in this format:

* Quarter {t}: ...
  Add a short explanation of your expectations.
Prompt Explanation: The AI was prompted to recall actual macroeconomic data values from past quarters to test whether its forecasting capabilities relied on memory of future information.
You are tasked with recalling the realized values of the following U.S. macroeconomic variables for {quarter_year}:
1. Real GDP (annual rate, 2010 base)
2. CPI inflation rate (annual rate)
3. Civilian unemployment rate (percentage)
4. 3-month Treasury bill rate (percentage)

Please list the actual values as best as you remember from your training data. Do not estimate or predict values—report only what you have learned.

If you do not know, say "Unknown".
⏰ When is this relevant?
A subscription meal kit service wants to test reactions to a new "plant-based quick meals" offering. The business wants to know how three key customer segments—busy professionals, health-conscious parents, and budget-minded students—would describe their likelihood to try, perceived benefits, and any objections, using AI personas instead of live interviews.
🔢 Follow the Instructions:
1. Define audience segments and create AI persona profiles: Write a brief description for each segment, specifying details like age, lifestyle, values, and eating habits. For example:
• Busy professional: Age 34, single, works long hours, values convenience, eats out often.
• Health-conscious parent: Age 42, two kids, shops organic, cooks at home, checks nutrition labels.
• Budget-minded student: Age 22, lives with roommates, on a tight budget, prefers cheap, filling meals.
2. Prepare the product concept and prompt template: Summarize your offering in 2–3 sentences. Example:
“Our new plant-based quick meals are designed for people on the go. Each kit includes fresh, pre-portioned ingredients and takes under 15 minutes to prepare. They are affordable, nutritionally balanced, and environmentally friendly.”
Prompt template:
You are [persona description].
PRODUCT: [product concept]
QUESTION: What is your immediate reaction to this product? Would you consider trying it? What do you like or dislike about it? Respond as you would in a real interview, using 3–5 sentences.
3. Run the simulation for each persona: Input the persona and prompt into your chosen AI model (like GPT-4). For each segment, generate 5–10 unique responses to capture a range of opinions. Adjust temperature or slightly rephrase the question to add variation.
4. Probe for deeper insight with follow-up prompts: For each segment, ask one or two follow-up questions based on typical objections or curiosity, such as:
• ""What factors would make you more likely to subscribe to this meal kit?""
• ""Are there any concerns or hesitations you have?""
• ""How does this compare to other meal kits or food options you use now?""
5. Theme and sentiment tagging: Review all responses and tag common themes (e.g., “mentions convenience,” “concerned about price,” “likes health benefits,” “skeptical of taste”). Mark sentiment as positive, neutral, or negative for each response.
6. Compare insights across segments: Create a summary table showing which features or objections are most common by segment. Note if certain benefits (speed, health, affordability) or barriers (cost, taste, skepticism) cluster by persona.
🤔 What should I expect?
You’ll have a clear map of what each target customer type values or worries about with the new product, which messages resonate best, and which objections are most frequent—enabling your team to refine marketing, product features, or follow-up real-world testing with minimal risk.<br>