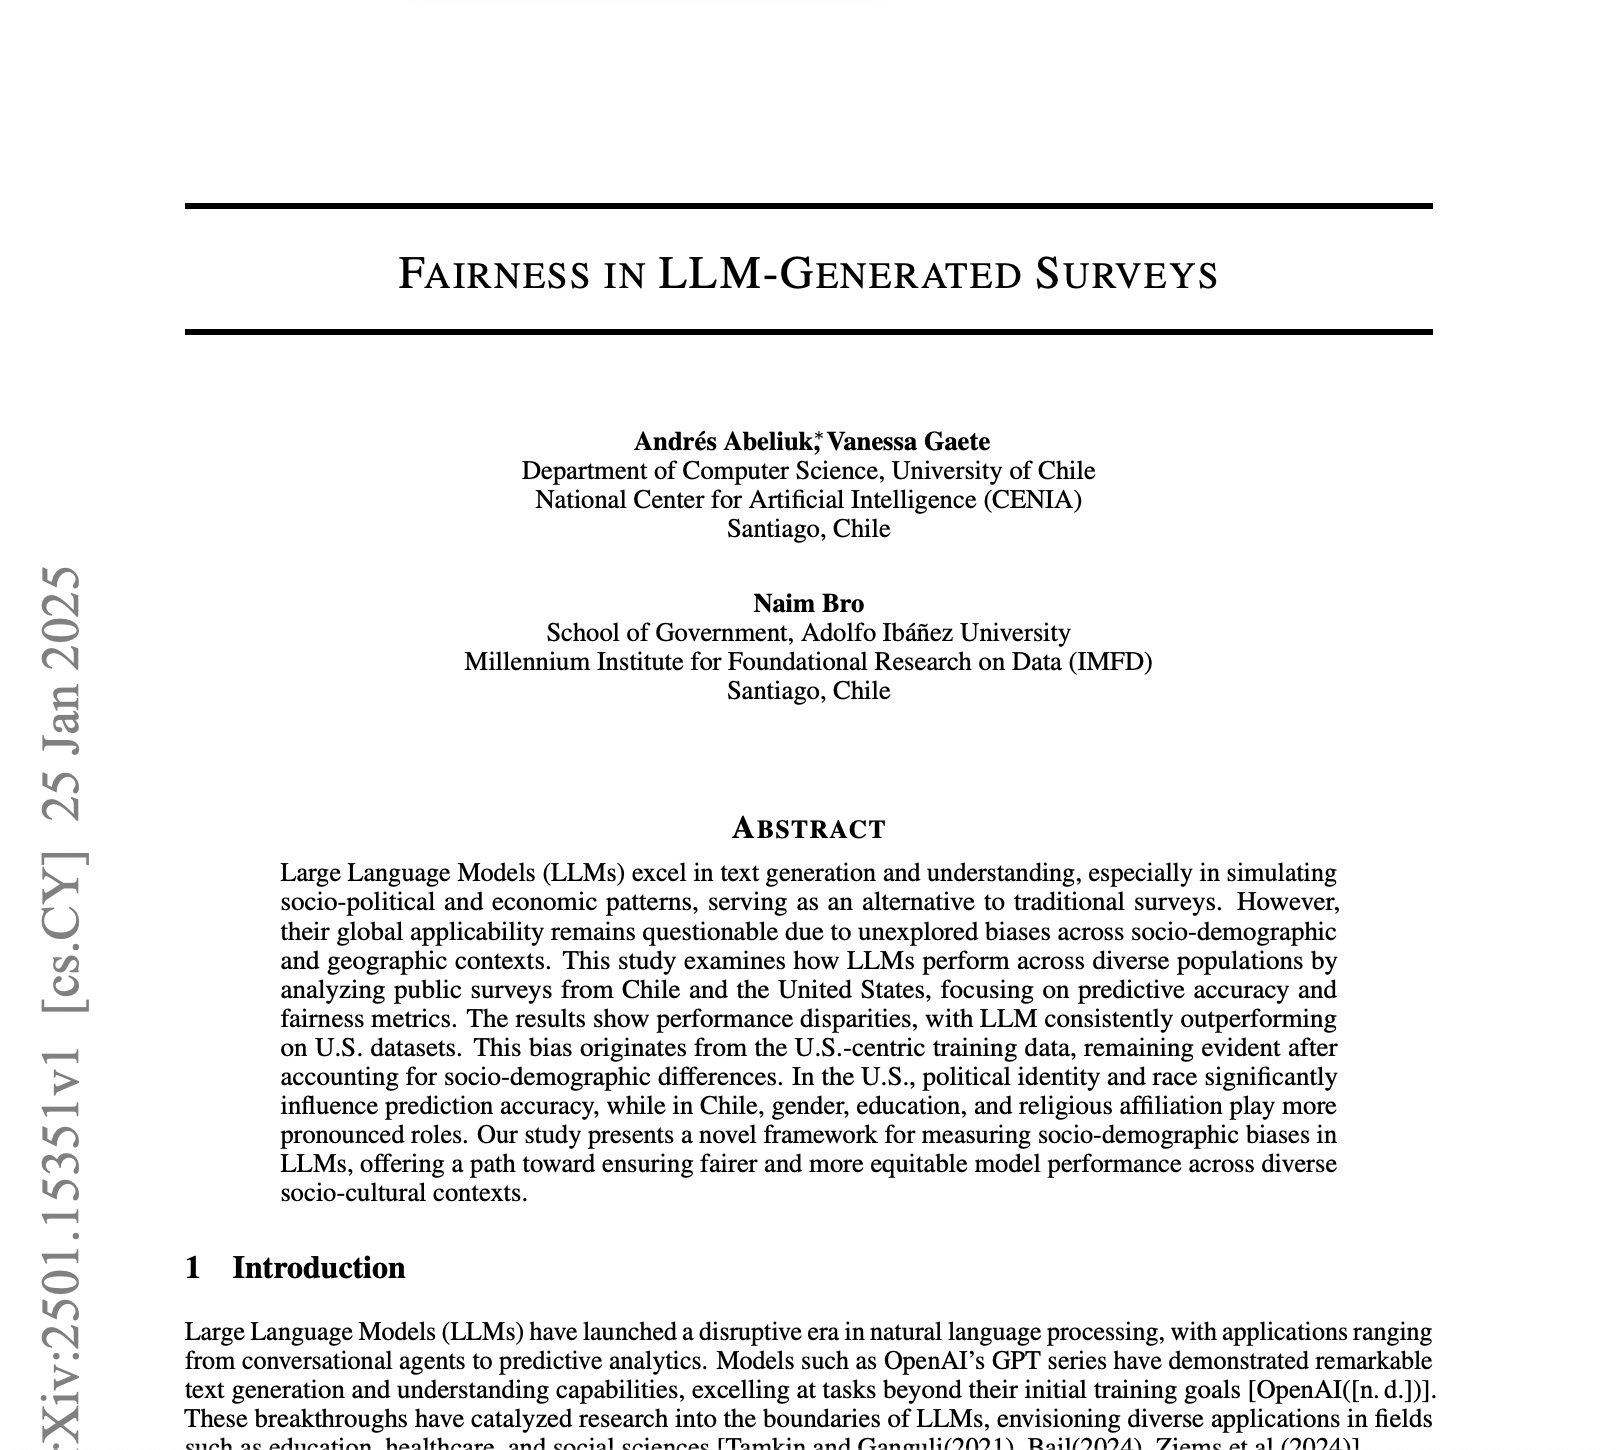
Fairness in LLM-generated Surveys
postAndrés Abeliuk, Vanessa Gaete, Naim Bro
Published: 2025-01-25
🔥 Key Takeaway:
Crafting careful prompts and choosing the right LLM are crucial—and prompt tweaks alone do not dominate over model upgrades or demographic conditioning.
🔮 TLDR
This paper benchmarks large language models (LLMs) like GPT-4, GPT-3.5, Llama-13B, and Mistral on their ability to predict survey responses from both U.S. and Chilean datasets and measures how fair and accurate these predictions are across different socio-demographic groups. The results show all models perform much better on U.S. data than Chilean data, likely due to U.S.-centric training data. Llama-13B had the best overall accuracy, especially for population-level trends, but all models showed biases: in Chile, predictions were less accurate for women, older adults, those with lower education, and religious groups; in the U.S., accuracy dropped most for low-income individuals and certain intersections of gender and race. Fine-tuning on local data gave only minor improvements and sometimes introduced new biases. Prompt design mattered—a chain-of-thought, English, few-shot prompt worked best and improved reliability, while models were less sensitive to prompt tweaks in the U.S. context than in Chile. Removing political variables from prompts hurt U.S. prediction accuracy more than Chilean, indicating the differing role of political identity. Main actionable takeaways: (1) LLM predictions on synthetic audiences are much more reliable for U.S./well-represented groups than for underrepresented countries or demographics; (2) group and intersectional fairness metrics are critical for diagnosing hidden biases in simulated survey results; (3) prompt engineering (CoT, few-shot, relevant language) has a large effect; (4) to improve generalization, invest in collecting and fine-tuning on local, diverse data and monitor for new biases after fine-tuning; (5) LLMs are best for population-level trend simulation, not individual prediction fidelity, especially outside the U.S.
📊 Cool Story, Needs a Graph
Table 1: "Performance metrics across different models for various experiments, using the same chain of thought prompt across all tests."
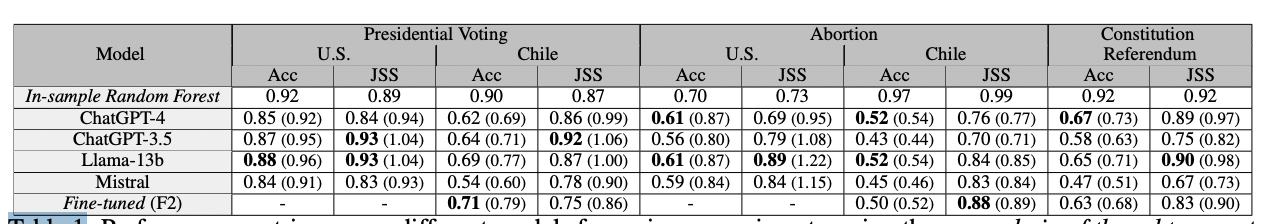
Side-by-side accuracy and divergence metrics comparing all LLMs, the fine-tuned model, and the random forest baseline across prediction tasks.
Table 1 presents a comprehensive grid of prediction accuracy (Acc) and Jensen-Shannon Similarity (JSS) for each model—ChatGPT-4, ChatGPT-3.5, Llama-13B, Mistral, and a fine-tuned variant—benchmarked against an in-sample random forest baseline across five tasks (U.S. and Chile presidential voting, abortion opinion, and Chilean constitutional referendum). For each task, results are displayed as both raw scores and as ratios to the random forest, providing an at-a-glance comparison of the proposed LLM-based survey simulation method versus classical and alternative LLM approaches in one view, and highlighting where models excel or lag on different datasets and demographic contexts.
⚔️ The Operators Edge
A detail that most experts might miss, but which is crucial to why this method works, is the study’s use of normalized performance metrics—specifically, comparing each AI model’s results not just in absolute terms but as a ratio to an in-sample random forest trained on the same data. This normalization step (see Table 1 on page 5 and repeated in ablation studies in the appendix) controls for differences in how predictable a given dataset or population is in the first place, revealing whether the AI’s “bad” results are because the model is weak, or because the underlying human population is harder to predict.
Why it matters: Without this kind of normalization, you might incorrectly judge a model as underperforming (or excelling) simply because you’re working with a population or dataset that’s inherently more or less predictable. By benchmarking every model against an upper-bound “traditional” machine learning baseline, you get a truer sense of whether your AI-driven approach is actually adding value. This is a hidden lever because it prevents you from blaming (or crediting) the AI for what is actually just a property of your research scenario.
Example of use: If you’re testing synthetic customer interviews for a niche B2B market and see much lower accuracy than for a broad consumer segment, checking how a classic algorithm (like a random forest) performs on the same data lets you see if the AI is really struggling, or if the population just doesn’t have strong, predictable patterns. You can then direct resources to improve data collection or segment definition, rather than overhauling your AI approach.
Example of misapplication: A team runs AI persona simulations for two different product concepts, gets much better results on one, and mistakenly attributes the difference to their prompt design or model tuning. They change models or prompts for the “weak” case, but nothing helps—because the real reason is that the underlying survey or customer group has lower predictability, not a technical flaw. By not normalizing against a baseline, they waste time chasing the wrong solution and may even report misleading results to leadership.
🗺️ What are the Implications?
• Focus on how you structure your questions—prompt design has a big impact: Studies found that using a well-crafted, multi-step prompt (like chain-of-thought with clear few-shot examples) consistently improved the realism and accuracy of AI-generated responses compared to just asking direct questions.
• Always include relevant examples and background when designing your study prompts: The best performing simulations provided the AI with 3-5 example answers and contextual information before collecting responses, helping the model better mimic real-world reasoning and choices.
• Test your prompts before running large studies: Performance varied significantly based on prompt details—what works for one topic or region may not work for another. Small-scale pilot tests with different phrasings can help you find the most effective setup.
• AI audience simulations are much more reliable for U.S./Western samples: If your market or audience is outside the U.S. or in an underrepresented group, expect lower accuracy unless you invest in local data or careful calibration—AI models are still biased toward U.S.-centric responses.
• Don’t rely only on political or demographic variables: For some markets (like the U.S.), political identity is highly predictive, but in others (like Chile), a broader mix of demographic and behavioral data is needed for accurate simulation.
• Use fairness metrics to check for hidden biases: Even high-performing AI simulations can under-represent or mischaracterize certain subgroups (e.g., women, low-income, or minority participants). Review results by subgroup and correct for any skewed patterns before making business decisions.
• Fine-tuning can help, but is not a silver bullet: Customizing your AI model with local survey data improved results only slightly and sometimes introduced new biases—so use it as a supplement, not a replacement for good prompt design and validation.
• AI simulations are best for trends and group-level insights, not exact individual predictions: Treat results as directional guidance; for high-stakes or highly segmented targeting, consider blending synthetic data with real-world checks.
📄 Prompts
Prompt Explanation: The AI was prompted to simulate survey respondents by using a structured prompt with chain-of-thought, in English, including few-shot examples, and without event-specific context, inputting socio-demographic features and the survey question/options to generate an answer as if from a persona.
[DEFAULT PROMPT: Original Prompt]
Input: [Socio-demographic characteristics], [target question], [response options]
Instruction: Think step by step based on the characteristics provided and choose the most likely answer. Here are 5 examples: [few-shot examples]. Now, for the following case: [persona information and survey question/options], provide your reasoning and then your answer.
Prompt Explanation: The AI was prompted in Spanish with a direct translation of the default structure, maintaining chain-of-thought and few-shot examples, to simulate a respondent in a Spanish-speaking context.
[PROMPT: Spanish Prompt]
Entrada: [Características sociodemográficas], [pregunta objetivo], [opciones de respuesta]
Instrucción: Piensa paso a paso según las características proporcionadas y elige la respuesta más probable. Aquí tienes 5 ejemplos: [ejemplos few-shot]. Ahora, para el siguiente caso: [información de persona y pregunta/opciones de encuesta], proporciona tu razonamiento y luego tu respuesta.
Prompt Explanation: The AI was given a zero-shot persona prompt excluding few-shot examples and minimal guidance, asking it to answer as a simulated respondent based only on the provided characteristics and question.
[PROMPT: Zero-Shot Prompt]
Input: [Socio-demographic characteristics], [target question], [response options]
Instruction: Based on these characteristics, select the most likely response.
Prompt Explanation: The AI was provided an enhanced persona prompt that included event-specific context along with the default structure, to assess if additional background information would improve its simulated respondent answer.
[PROMPT: Prompt with Context]
Context: [Event-specific background information]
Input: [Socio-demographic characteristics], [target question], [response options]
Instruction: Using the context and characteristics above, think step by step and provide the most likely answer. Here are 5 examples: [few-shot examples]. Now, for the following case: [persona information and survey question/options], provide your reasoning and then your answer.
⏰ When is this relevant?
A financial services company wants to understand how three distinct customer segments—young professionals, mid-career families, and retirees—would respond to a new flexible savings account product. The goal is to simulate qualitative feedback and preference ranking for key features (e.g., no-fee withdrawals, interest bonuses, digital tools) to inform marketing and product positioning.
🔢 Follow the Instructions:
1. Define audience segments: Create three AI persona profiles to match your main market segments. Example:
• Young professional: Age 27, city-based, digital-first, values flexibility, moderate savings experience.
• Mid-career family: Age 40, married with kids, suburban, values security and long-term growth, busy schedule.
• Retiree: Age 68, rural area, fixed income, risk-averse, values stability and ease of access.
2. Prepare the prompt template: Use this structure for each simulated persona:
You are simulating a [persona description].
Here is the product concept: “The FlexSave account offers no-fee withdrawals, tiered interest bonuses for higher balances, and a digital dashboard for tracking savings goals. Customers can open or close accounts online and receive monthly financial tips.”
You are being interviewed by a market researcher.
Respond naturally and honestly as your persona, using 3–5 sentences.
First question: What is your first reaction to the FlexSave account and which feature grabs your attention most?
3. Simulate responses for each segment: Run the prompt through an AI model (e.g., GPT-4) for each persona, generating 10–20 responses per segment. Slightly vary the phrasing in the prompt to mimic different interviewer styles and surface a range of natural answers.
4. Ask follow-up questions: For each persona, ask two follow-ups based on their initial comments. Example: “Would this account change how you manage your savings?” and “Is there anything missing or unclear about this product?”
5. Tag and summarize key feedback themes: Review responses and tag with qualitative labels like “likes digital tools,” “concerns about fees,” “values flexibility,” or “prefers traditional banking.” Group responses by segment to identify patterns.
6. Compare preferences across segments: Summarize which features are most and least attractive to each group, noting where opinions diverge. Highlight any unexpected objections or positive reactions that could shape positioning or messaging.
🤔 What should I expect?
You’ll get a clear, segment-by-segment view of which product features resonate most, what objections or confusion might arise, and how each group frames their savings needs. This helps you prioritize product messaging, refine features, and target marketing for each audience before investing in live research or a market launch.