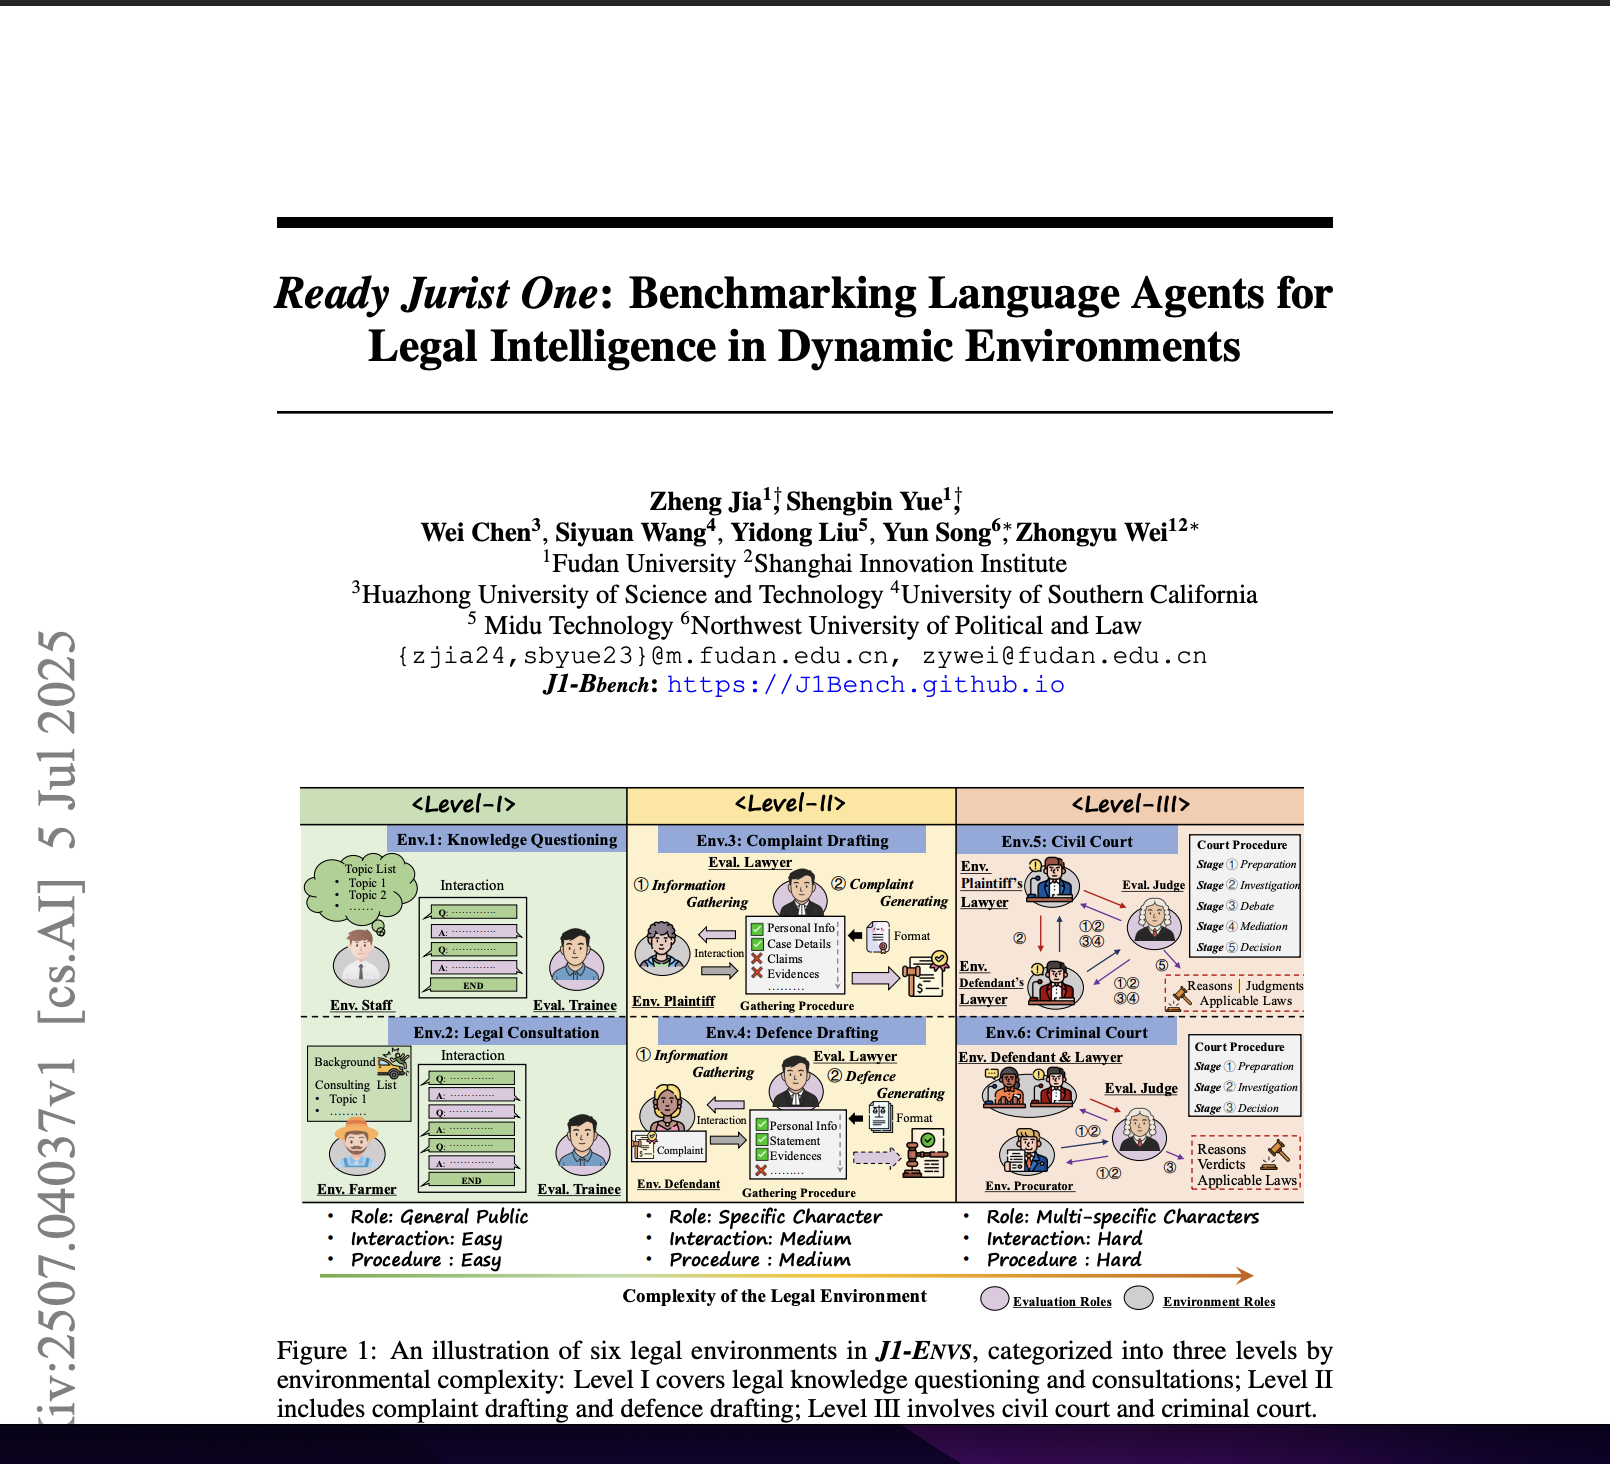
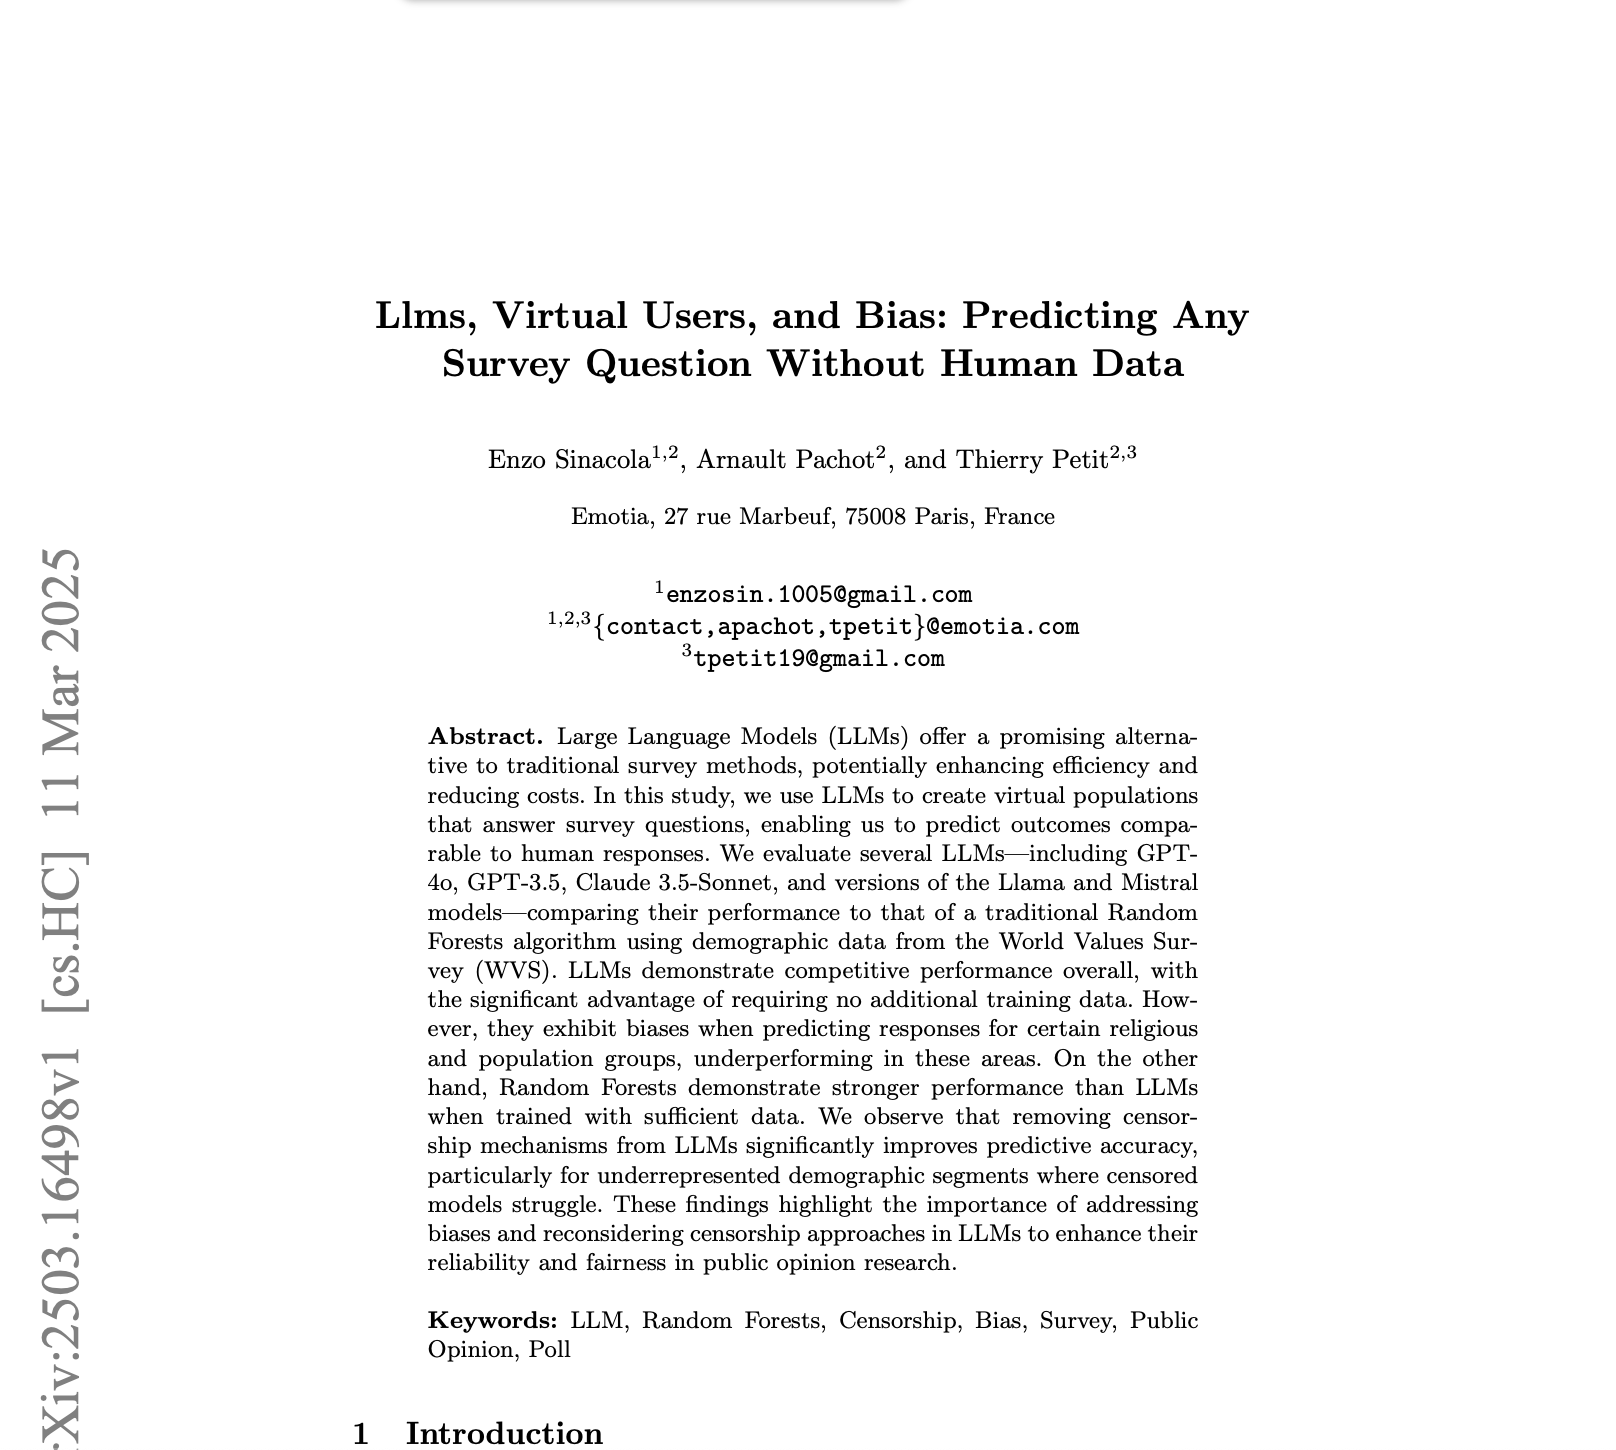
LLMs, Virtual Users, and Bias: Predicting Any Survey Question Without Human Data
postEnzo Sinacola, Arnault Pachot, Thierry Petit
Published: 2025-03-11
🔥 Key Takeaway:
When you remove censorship/bias‐correction from LLMs (“Dolphin‐enhanced” versions), predictive accuracy improves—particularly for small or sensitive demographic groups (e.g., certain religions or ethnicities) where the censored models underperform.
🔮 TLDR
This study compared large language models (LLMs) like GPT-4o, Claude 3.5-Sonnet, and Llama/Mistral variants to traditional Random Forests for predicting survey responses using World Values Survey data (94,278 people, 64 countries, 35 demographic features, 196 questions). LLMs achieved competitive accuracy (~71% for GPT-4o/Claude 3.5-Sonnet) without needing any training data, but Random Forests trained on 95% of the data performed best (74.9%). LLMs worked better for European, Latin American, and Christian/non-religious groups (up to 67% accuracy), but underperformed on South Asian, Middle Eastern, Buddhist, and Islamic groups (down to 54–56%), revealing demographic bias. Importantly, removing LLM censorship (“uncensored” Dolphin models) increased accuracy by up to 5% for underrepresented groups. Prompt structure modestly affects LLM results, while running at low temperature increases consistency. Takeaways: LLMs can substitute for human surveys with reasonable accuracy and zero training, but are less reliable for minority populations unless censorship is removed and diverse data is incorporated; for best fidelity, avoid censored models, tune prompts, and be cautious with results for underrepresented demographics.
📊 Cool Story, Needs a Graph
Figure 2: "Average Accuracy by Models"
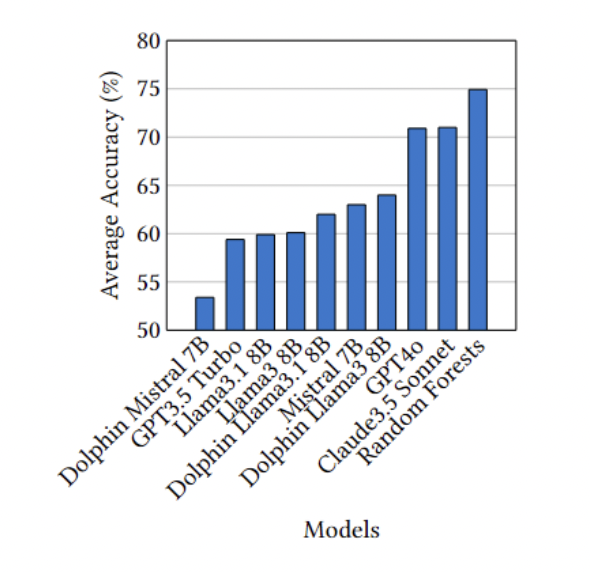
Side-by-side accuracy comparison of LLMs and Random Forests on survey prediction.
Figure 2 presents a bar chart displaying the average prediction accuracy for each tested model—including GPT-4o, Claude 3.5 Sonnet, multiple Llama and Mistral variants (both censored and uncensored), and the Random Forests baseline—on the same survey task. The figure enables direct visual comparison between all LLMs and the traditional machine learning baseline, clearly showing that while Random Forests (trained on 95% of the data) achieve the highest accuracy (~75%), top LLMs like Claude 3.5 Sonnet and GPT-4o are close behind (~71%), and uncensored Llama/Mistral variants generally outperform their censored counterparts. This snapshot allows for rapid assessment of relative model strengths in replicating human survey responses.
⚔️ The Operators Edge
A crucial detail that even seasoned experts might overlook is the way the study maintains balanced representation across demographic groups by *equalizing the number of synthetic personas for each group*, regardless of their frequency in the real world. Instead of letting larger groups dominate the simulation, the researchers deliberately sample the same number of personas for each ethnicity and religion (see methodology on pages 5–6), ensuring that minority perspectives are not statistically drowned out or ignored.
Why it matters: This balancing act is essential for revealing where AI models perform poorly or exhibit bias—especially for underrepresented groups. It exposes gaps that would be hidden if you simply matched real-world proportions, because small groups would generate too little data to analyze. In effect, this method transforms the “edge cases” into visible, measurable segments, helping teams spot and address model weaknesses before they impact real customers or decision-making.
Example of use: A company simulating reactions to a nationwide ad campaign uses this approach to ensure equal representation of different ethnic and religious groups in their synthetic audience. As a result, they discover that the AI model is far less accurate in predicting the opinions of rural Muslim women than urban secular men. This insight flags a need for additional research or targeted messaging, reducing the risk of a public misstep or missed market.
Example of misapplication: Another team runs their simulation with synthetic personas sampled in proportion to real population data, so minority groups are a tiny fraction of the total audience. When the AI underperforms for these groups, the effect is statistically buried—nobody notices, and the campaign goes live with hidden bias. The company is caught off guard when complaints or negative feedback later emerge from those underrepresented segments, damaging brand trust and requiring costly remediation.
🗺️ What are the Implications?
• Leverage synthetic audiences for rapid, low-cost insights: AI-based virtual populations can predict survey responses with accuracy close to traditional methods, allowing market researchers to quickly test ideas or concepts without recruiting large human samples.
• Use real demographic data to design your virtual personas: Basing your simulated audience on actual survey or census demographics (rather than made-up profiles) helps ensure the outputs better reflect real-world opinions and reduces the risk of bias.
• Spot-check results in underrepresented groups: The study found that AI personas are less accurate when simulating responses from smaller or minority populations (e.g., certain religions or regions), so always review or supplement findings for these groups with targeted human input if possible.
• Choose uncensored models for sensitive topics: Removing content filters from language models led to more accurate predictions, especially for groups or questions where censored models struggled—consider using less-restricted AI for market research that touches on controversial or nuanced issues.
• Don't over-invest in the newest or largest AI model: Multiple models performed similarly in this study, so businesses can often use cost-effective, smaller, or open-source models and still get reliable results—resources might be better spent on better study design or validation.
• Fine-tune and test your prompts before full rollout: Small changes in how questions are worded for the AI can modestly boost accuracy; iterating on prompt design or running a few test queries before full-scale research can make simulations more dependable.
• Supplement synthetic studies with targeted human research: Since LLMs still can’t perfectly predict minority or outlier opinions, use a hybrid approach: run broad simulations for early insights, then validate with small, focused human studies in key segments.
📄 Prompts
Prompt Explanation: The AI was prompted to answer survey questions by simulating virtual populations based on demographic features, focusing on predicting binary, categorical, and scaled opinion responses from structured demographic input.
Given the following demographic characteristics: Age, Gender, Education level, Religion, Marital status, Socioeconomic status, Country of origin, predict the answer to this survey question: {survey question text}.
Prompt Explanation: The AI was instructed to generate survey responses for members of specific population groups (e.g., ethnic or religious groups) by randomly selecting demographic profiles and simulating their answers to survey questions.
Assume you are a member of the following group: {ethnic or religious group label}. Your demographic profile is: {demographic data}. Please answer the following binary survey question as you would, given your characteristics: {survey question text}.
Prompt Explanation: The AI was directed to compare prediction results using censored versus uncensored model versions by simulating responses for the same demographic profiles and questions under each setting.
You are an AI model simulating a virtual user with the following demographic features: {demographic data}. Using the {censored/uncensored} version of the model, answer this survey question: {survey question text}.
⏰ When is this relevant?
A national grocery chain wants to understand how different customer groups might respond to a new digital loyalty program before investing in a full rollout. They want to simulate survey responses from three core segments: tech-savvy urban singles, price-driven rural families, and busy suburban parents. The goal is to identify which features (e.g., app rewards, in-store discounts, personalized offers) are likely to drive adoption and surface any objections or confusion.
🔢 Follow the Instructions:
1. Define audience segments: Create three AI persona profiles, each with distinct, realistic attributes. Example:
• Tech-savvy urban single: 29, lives in a city, early adopter of apps, values convenience and digital rewards.
• Price-driven rural family: 42, rural town, budget-conscious, less comfortable with technology, values clear savings.
• Busy suburban parent: 37, two kids, suburban, juggles work and parenting, values both time savings and family-friendly offers.
2. Prepare prompt template for persona simulation: Use the following format for each segment:
You are simulating a [persona description].
Here is the new loyalty program being tested: "A smartphone app provides points for every purchase, offers personalized digital coupons, and gives monthly in-store discounts for frequent shoppers."
You are answering a survey for the grocery chain.
Respond honestly and naturally as this persona in 3–5 sentences.
First question: What is your initial reaction to this loyalty program and how likely are you to use it?
3. Run the prompt for each persona type: For each segment, generate 10–20 responses by slightly varying the prompt wording (e.g., "What do you like or dislike about this program?" or "Would this change how you shop at our stores?").
4. Probe for feature-level feedback: Add follow-up prompts such as:
"What features would make you more likely to use the program?"
"Is anything confusing or unappealing about how the program works?"
"How does this compare to other loyalty programs you know?"
5. Tag and summarize responses: Review the simulated answers and tag recurring themes—such as "positive about digital rewards," "concerned about app complexity," "wants more in-store options," or "prefers traditional coupons." Note positive, negative, or neutral sentiment for each segment.
6. Compare and report findings across segments: Summarize which features and messages resonate with each persona. Highlight objections, confusion, or recurring requests. Identify where one group is highly positive but another is skeptical or indifferent.
🤔 What should I expect?
You'll get a clear, directional understanding of which loyalty program features are likely to appeal to each customer type, where potential barriers or confusion exist, and which messaging or incentives could drive higher adoption—allowing you to prioritize program design and communication strategies before investing in a real-world pilot.