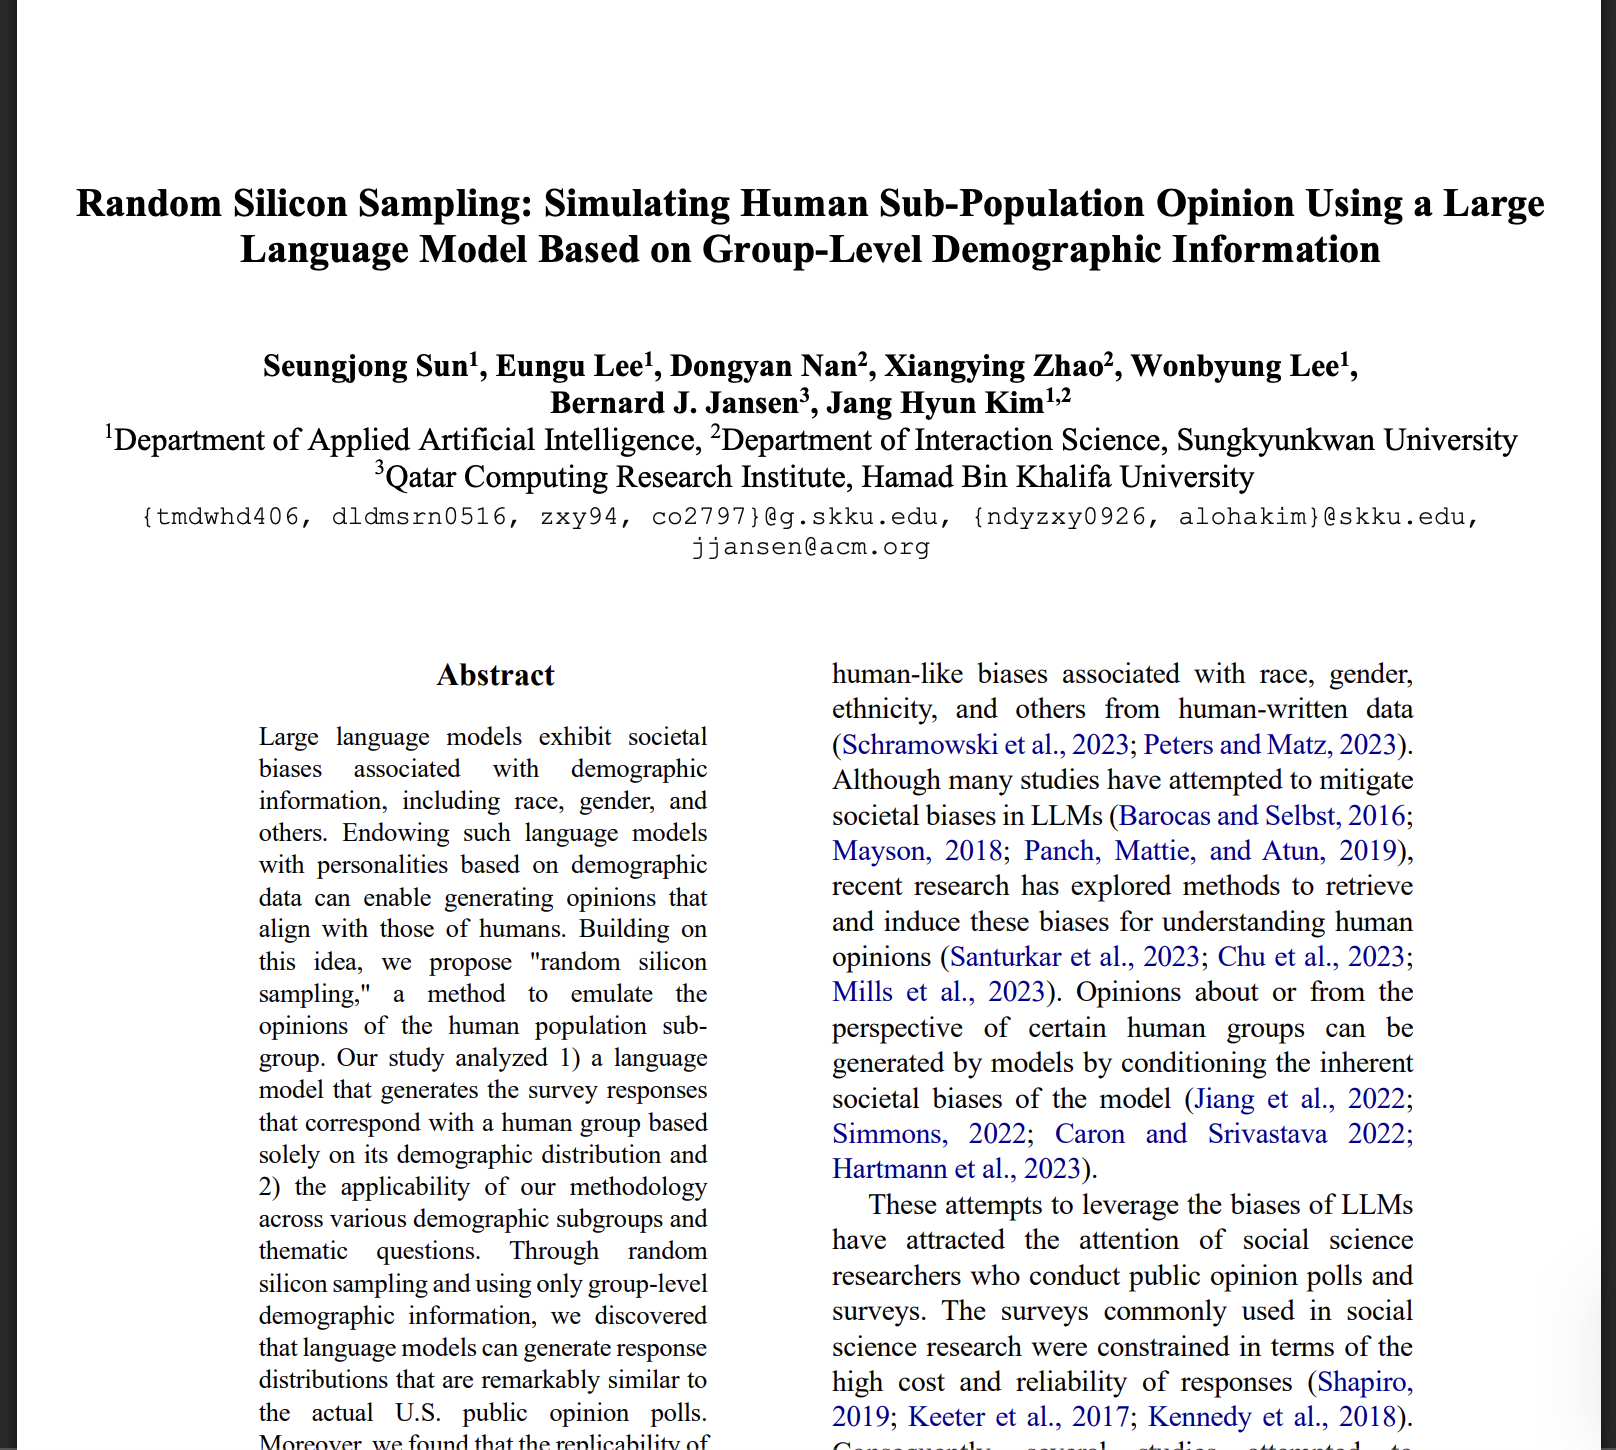
Random Silicon Sampling: Simulating Human Sub-population Opinion Using a Large Language Model Based on Group-level Demographic Information
postSeungjong Sun, Eungu Lee, Dongyan Nan, Xiangying Zhao, Wonbyung Lee, Bernard J. Jansen, Jang Hyun Kim
Published: 2024-02-28
🔥 Key Takeaway:
To mirror a real population’s opinion distribution, all you need is a large synthetic pool drawn by randomly sampling from the group’s demographic breakdown. Even without any detailed life story, that ‘random silicon sampling’ matches U.S. poll results nearly perfectly—showing that statistical diversity, rather than crafting each respondent’s backstory, is the key to realistic synthetic survey cohorts.
🔮 TLDR
Sun et al. (2024) introduce “random silicon sampling,” where you draw a large synthetic cohort by randomly sampling individual demographics (age, gender, race, education, etc.) to match a target group’s distribution, then prompt GPT-3.5-turbo with only those demographics + survey question. On the 2020 ANES voting question, this method yields an average KL-divergence of ≈ 0.0004—better than prior “silicon sampling.” Replicability remains high when you use ≥ ≈ 200 synthetic respondents; below that, divergence rises. Across 23 stratified subgroups and 10 varied ANES questions, LLM outputs sometimes “overshoot” to extreme poles (e.g., nearly unanimous support in some slices) or misrepresent sensitive topics—revealing embedded societal biases in GPT-3.5. Sun et al. conclude that, while you can cheaply mirror group-level opinions using only demographic proportions, accuracy depends on (1) sample size, (2) subgroup size/topics, and (3) LLM bias—so this should serve as a preliminary or pilot simulation tool, not a full substitute for real survey data.
📊 Cool Story, Needs a Graph
Table 1: Replicability of random silicon sampling
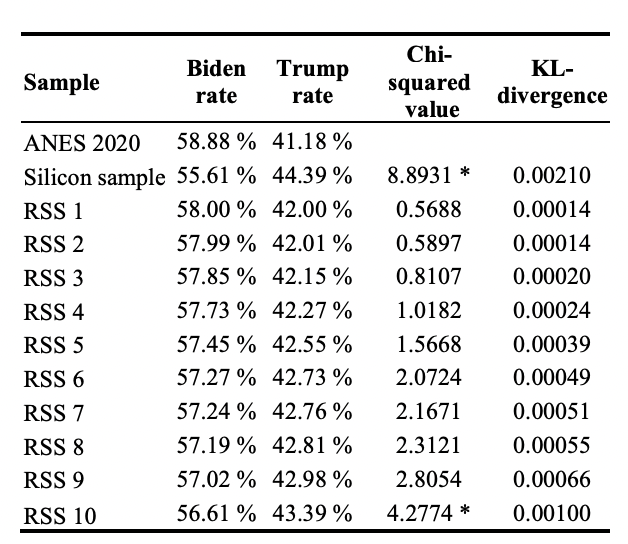
Comparison of actual, silicon sample, and random silicon sample voting results and distribution similarity metrics.
Table 1 (page 4) presents a direct, side-by-side comparison between the actual ANES 2020 voting distribution, the conventional "silicon sample" baseline, and ten independent runs of the proposed random silicon sampling method. For each, it lists the Biden and Trump vote rates, the chi-squared test statistic (with significance), and the KL-divergence against the real ANES responses. This layout makes it easy to see at a glance that random silicon sampling consistently produces results much closer to the real data than the silicon sample baseline, both in raw percentages and statistical similarity metrics, providing clear evidence of the method's advantage.
⚔️ The Operators Edge
One subtle but crucial detail in this study is that the “random silicon sampling” method doesn’t just randomly assign demographic attributes to AI personas—it samples each attribute independently from the real-world joint demographic distribution of the target group. This means each virtual respondent’s combination of race, gender, age, ideology, party, and so on, is statistically representative of how those combinations actually appear in the population, rather than being a simple random mix or a fixed set of archetypes.
Why it matters: This approach preserves the real-world correlations between demographic factors that often drive opinions and behaviors (e.g., age and ideology, or race and party affiliation). Most experts might overlook this, assuming that as long as you match marginal distributions (e.g., “30% of personas are 18-29, 70% are white, 40% are conservative”), you’ll get realistic results. However, if you ignore the way these factors interact within individuals, you risk creating synthetic populations that look plausible on paper but miss the nuanced patterns that shape actual group responses—leading to misleading predictions or masking real market risks.
Example of use: Suppose a company is using AI personas to simulate reactions to a new banking app feature, and they build their virtual audience by sampling each persona’s attributes (income, age, location, tech comfort, etc.) according to the real joint distribution from a census or customer database. The resulting feedback accurately reflects, for example, that high-income, older users in rural areas are both more tech-cautious and less likely to be early adopters—a pattern that emerges only when you preserve these attribute correlations.
Example of misapplication: If the same company builds their synthetic panel by assigning each attribute independently—so that “urban,” “high-income,” “senior,” and “tech enthusiast” are just as likely to be combined as any other mix—they may end up with lots of personas that don’t actually exist in the real customer base (e.g., high-income, elderly, urban tech super-users). This distorts the aggregate results, making it appear that certain features are either more or less appealing than they would be in the true market, and can lead to bad decisions about feature prioritization or rollout strategy.
🗺️ What are the Implications?
• Use real demographic data to build your virtual audiences: Simulations that matched the actual demographic breakdown of the target population (like age, gender, ethnicity, ideology, etc.) produced results much closer to real-world survey outcomes than those using random or generic personas.
• Don’t cut corners on sample size—small samples can be misleading: The study found that simulated audience sizes below 200 led to unreliable or even reversed results; using at least 200 synthetic respondents is necessary to reflect the diversity of opinions in the real market.
• Check for “overconfidence” and bias in simulated group responses: AI personas sometimes exaggerate how similar people in the same group are (e.g., 99% of Democrats voting one way), which can make market risks or opportunities look bigger or smaller than they really are. Review results for signs of unrealistic consensus.
• Be cautious on sensitive or controversial topics: AI-generated audiences tend to give “safe,” socially acceptable answers on issues like race, gender, or healthcare, which can mask true underlying concerns or disagreements in your real market.
• Use simulations for early testing, not final decisions: Because simulated results are fast and cheap (5,000+ responses in under an hour for less than $1), they’re great for shaping early concepts or prioritizing further research—but should not fully replace real customer validation.
• Validate with real data when possible: Even with strong demographic matches, AI personas can reflect hidden biases from their training data. Whenever possible, use a small real-world pilot or follow-up survey to confirm key findings before launching or scaling a new product.
• Adjust your approach for different markets or groups: The effectiveness of synthetic research varied by demographic and topic, so don’t assume one method fits all—test and tune your simulated audience for the specific customer segment or region you care about.
📄 Prompts
Prompt Explanation: The AI was prompted to role-play as a synthetic survey respondent by taking on randomly sampled demographic attributes (from a target group distribution) and then providing a first-person answer to a survey question as part of the random silicon sampling methodology.
System prompt: Racially, I am black. I like to discuss politics with my family and friends. Ideologically, I am strongly liberal. Politically, I am a democrat. I do not attend church. I am 33 years old. I am a man. I am highly interested in politics.
User prompt: In the 2020 presidential election, Donald Trump is the Republican candidate, and Joe Biden is the Democratic candidate, and I voted for __ __
Prompt Explanation: The AI was prompted to role-play as a synthetic survey respondent with another unique set of demographic attributes, again answering a presidential voting question in the first person.
System prompt: Racially, I am white. I like to discuss politics with my family and friends. Ideologically, I am slightly conservative. Politically, I am a strong Republican. I attend church. I am 80 years old. I am a woman. I am somewhat interested in politics.
User prompt: In the 2020 presidential election, Donald Trump is the Republican candidate, and Joe Biden is the Democratic candidate, and I voted for __ __
Prompt Explanation: The AI was prompted to play a first-person persona, with date and a detailed demographic profile, to answer a multiple-choice social/political survey question as part of the random silicon sampling methodology.
System prompt: Today is November 3, 2020. Racially, I am white. I like to discuss politics with my family and friends. Ideologically, I am slightly conservative. Politically, I am an independent who leans Republican. I do not attend church. I am 53 years old. I am a woman. I am somewhat interested in politics.
User prompt: Question: What do you think about the state of the economy these days in the United States?
Answer choices:
1. Very good 2. Good 3. Neither good nor bad 4. Bad 5. Very bad
My answer is __
⏰ When is this relevant?
A national quick-service restaurant wants to test how three distinct customer segments (urban college students, suburban families, and rural retirees) would respond to a new loyalty rewards app, before investing in a full-scale rollout. The goal is to simulate survey responses to measure likelihood of app adoption, perceived value, and any segment-specific objections.
🔢 Follow the Instructions:
1. Define customer segments: Choose 3–5 realistic personas that reflect actual customer data (e.g., from loyalty database or market research). For this example:
• Urban college student: 21, lives in a city, eats out 3–4x/week, values deals, uses smartphone for everything.
• Suburban family parent: 42, two children, eats out on weekends, values family offers, moderate tech comfort.
• Rural retiree: 68, lives outside town, loyal to a few brands, visits monthly, prefers simple experiences.
2. Prepare the prompt template: For each persona, use this structure:
You are a [persona description].
Here is the new app concept: ""Our loyalty app lets you earn points for every visit, redeem for free menu items, get birthday rewards, and receive exclusive app-only deals. It works on iOS and Android, requires basic signup, and is free to use.""
Imagine you have just learned about this app from the restaurant.
QUESTION: What is your honest first reaction to this loyalty app? Would you download and use it? Why or why not? Please answer as this customer in 2–4 sentences.
3. Generate responses for each persona: Using an AI language model, generate 10–20 unique responses for each persona by varying the prompt wording slightly (e.g., ""What would make you want to try this app?"" or ""Is there anything about this app that would stop you from signing up?"").
4. Add follow-up prompts: For each initial response, follow up with 1–2 questions to surface deeper motivations or objections. Example follow-ups:
• ""What kind of reward would make you use the app more often?""
• ""How do you feel about using your phone for restaurant rewards?""
• ""What could be improved to make the app more appealing to you?""
5. Tag and summarize key themes: Review the AI responses to identify recurring themes (e.g., ""values discounts,"" ""concerned about complexity,"" ""wants simple sign-up,"" ""prefers paper coupons""). Use simple tags and count their frequency within each segment.
6. Compare and report insights by segment: Summarize which features or messages are most attractive or off-putting for each segment. Note patterns, such as tech adoption barriers for retirees, or demand for instant rewards for students.
🤔 What should I expect?
You'll get a segmented qualitative view of likely customer reactions to the new loyalty app, with clear signals about which features drive adoption or resistance in each group. This helps prioritize app design, marketing messages, and where follow-up real-world testing is needed—enabling more targeted investment and risk reduction before launch.