Revealing Economic Facts: Llms Know More Than They Say
postMarcus Buckmann, Quynh Anh Nguyen, Ed Hill
Published: 2025-05-25
🔥 Key Takeaway:
The most accurate insights don’t come from the AI’s polished, confident text answers—but from its hidden, raw internal signals. If you want to know what the model really knows, ignore its words and read its mind: a few real-world examples piped into its guts will beat thousands of cleverly phrased questions, and even a small, messy training set lets you outsmart the AI’s surface-level output.
🔮 TLDR
This paper shows that large language models (LLMs) contain more accurate and detailed economic and financial knowledge in their internal “hidden states” (embeddings) than what they output as text when prompted. By training a simple linear model on the embeddings of open-source LLMs (sizes 1–70B parameters), the authors could estimate regional and company-level statistics (like unemployment, GDP, or firm assets) more accurately than by using the LLM’s text responses—especially for less common variables, where text outputs often clustered or missed the mark. Only a few dozen labeled samples were needed to train the linear model, making this approach sample-efficient. The study also shows that adding LLM embeddings as features improves standard imputation methods for missing data and enables “super-resolution” (estimating finer-grained statistics from coarser data). Transfer learning using embeddings and noisy text labels can further improve estimation without labeled data for the target variable. Key takeaways: (1) LLM embeddings hold richer, actionable information than text output; (2) using a linear probe on embeddings beats text-based answers for most non-mainstream variables; (3) augmenting traditional pipelines with LLM embeddings boosts imputation and fine-grained estimation tasks; (4) only modest labeled data is needed for strong results.
📊 Cool Story, Needs a Graph
Figure 1: Cross-validation performance
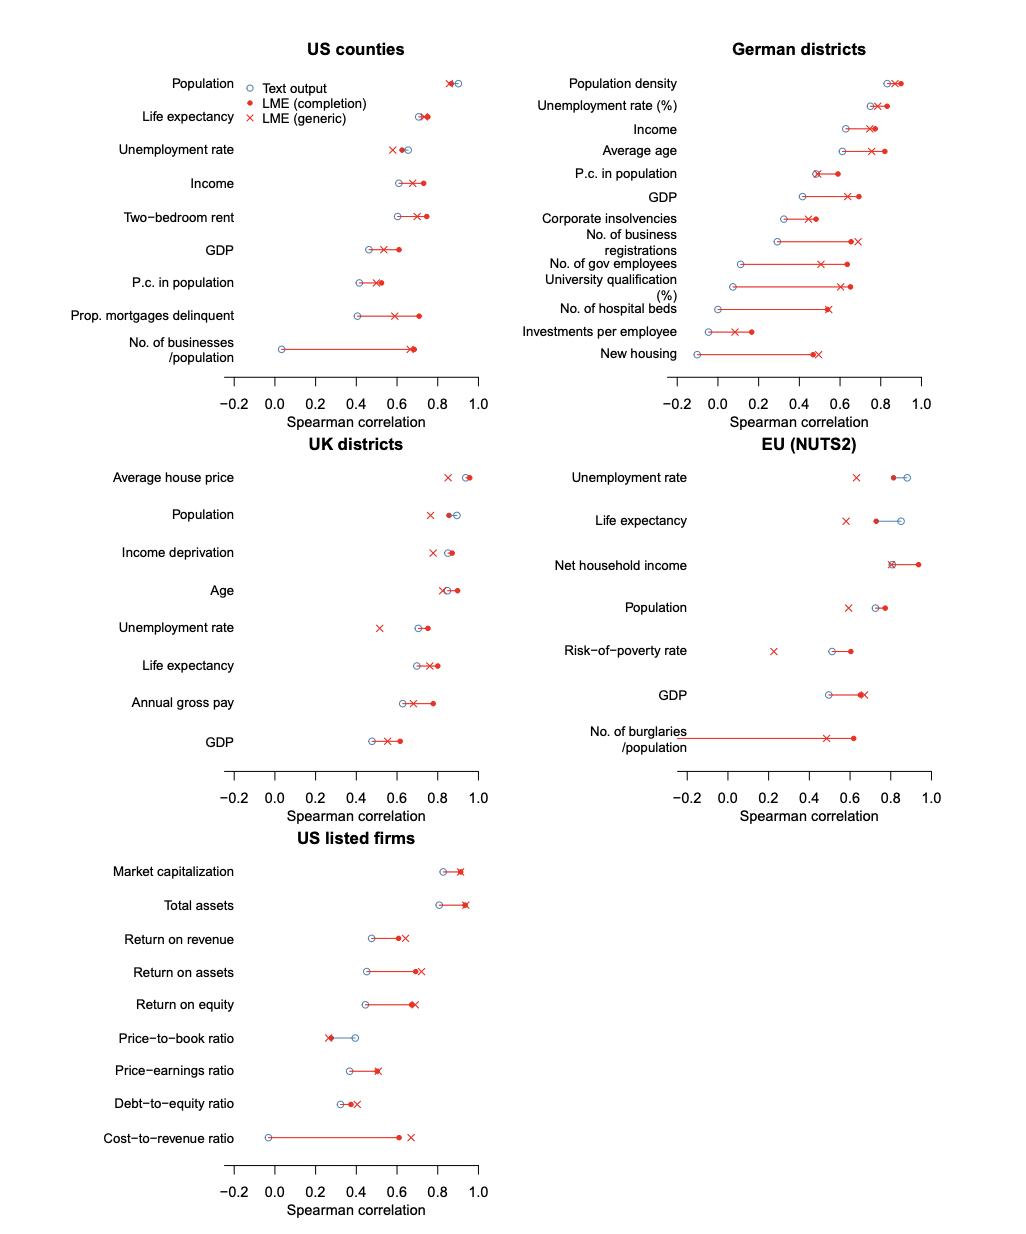
Side-by-side comparison of the proposed LME method, a generic LME baseline, and text output across five datasets and multiple variables.
Figure 1 presents grouped bar and point plots for five datasets (US counties, German districts, UK districts, EU regions, and US listed firms), displaying the Spearman correlation of three methods—LME (completion prompt), LME (generic prompt), and text output—on a range of variables for each dataset. Variables are ordered by the performance of the text output, and each method’s result is directly overlaid, making it easy to see where and how much LME provides improvements over text output and the generic baseline. This comprehensive layout succinctly contrasts the proposed method with traditional text-based LLM querying and a generic embedding baseline in a single, readable view.
⚔️ The Operators Edge
One subtle but crucial detail that makes the study’s method work so well—yet may be overlooked—is that the researchers train the linear model on the hidden state of the last token in the prompt (specifically from the 25th transformer layer), and they find that this layer encodes generalizable statistical structure better than other layers. This choice isn't arbitrary: it reflects an understanding that mid-to-late layers in large language models are where abstract, high-level concepts coalesce, while earlier layers are more syntactic and later layers can become task- or output-biased. By probing this specific internal representation (not the final layer), they strike the balance between richness and stability of encoded knowledge.
Why it matters: Many practitioners might assume that all hidden states are equally useful or default to using the final layer (since it’s closest to the output), but this study shows that choosing the right internal representation layer is a hidden lever—a methodological detail that significantly boosts performance. The 25th layer yields stronger correlations between LLM embeddings and ground truth statistics, particularly when training a simple linear model on just a few dozen samples. This insight generalizes: for any LLM application relying on embeddings or probing, performance hinges on selecting the right layer to extract information from.
Example of use: A fintech startup is building an AI-driven tool to estimate credit risk for small businesses using firm names and public data. Instead of training a deep neural net end-to-end, they extract embeddings from a medium-sized open-source LLM. Using the 25th layer’s final token embedding (mirroring the study's method), they fit a ridge regression on a small labeled dataset of known credit scores. This setup beats more complex alternatives because it taps the LLM's latent economic knowledge where it's encoded most reliably.
Example of misapplication: A data science team at an e-commerce company tries to use LLM embeddings to predict regional purchasing power. They extract embeddings from the final layer (or average all layers) without testing layer-wise performance. Their model underperforms and they abandon the approach, blaming the LLM. In reality, the issue was their assumption that the final layer is “best”—when, as this study shows, key knowledge is often buried earlier. Ignoring the layer selection masks the model’s real capabilities.
🗺️ What are the Implications?
• You don't need massive sample sizes to improve accuracy: The study found that even with just a few dozen real examples, you can train AI-based market research tools to be much more accurate—making small pilot studies or limited data collections highly valuable.
• Avoid relying on simple text answers from AI for nuanced questions: The research shows that standard AI text outputs often miss subtle patterns or cluster around generic answers, especially for less common or more detailed topics; using richer internal signals (""embeddings"") from AI models gives better predictions.
• Enhance traditional survey analysis with AI ""embeddings"": By combining a few real survey results with AI's internal knowledge (not just its text responses), you can fill in gaps, predict missing data, and get more reliable results from smaller or incomplete studies.
• AI tools can help estimate results even when data is scarce: If you lack enough ground-truth responses for a particular question, you can still get accurate estimates by blending AI's own noisy guesses with related data—reducing the need for large, expensive data-gathering campaigns.
• This approach saves time and budget on large-scale data cleaning: Because AI embeddings can help spot and correct missing or inconsistent responses, you may need to spend less on manual data cleaning, merging, or buying expensive third-party datasets.
• Simple, open-source AI is often good enough: You don't need to pay for the largest or most expensive AI models—smaller, open models produced similar accuracy when used this way, so resources are better directed to good study design and real-world grounding.
• Combining real data with AI leads to more credible, actionable insights: Stakeholders can feel more confident in market research findings when they know results are not just AI ""guesses,"" but are anchored in actual examples and enhanced by AI's ability to fill in the blanks intelligently.
📄 Prompts
Prompt Explanation: The AI was prompted to generate an estimate for a specific economic or financial variable by completing a direct and minimal completion-style prompt referencing the variable, region, and year of interest.
The {variable} in {region} in {year} was
Prompt Explanation: The AI was prompted to answer a direct question about an economic or financial statistic, with explicit instructions to provide an estimate if the answer is unknown and to return a short, number-focused response.
You are a helpful assistant. If you do not know the answer to the question, provide your best estimate. Answer shortly like this. 'My answer: {number}'
Prompt Explanation: The AI was prompted to answer a question using a question-answering format, sometimes including few-shot examples to guide its responses.
You are a helpful assistant. Answer the question. Use the format provided in the examples.
Prompt Explanation: The AI was prompted to provide a chain-of-thought response, encouraging stepwise reasoning before arriving at a numerical answer for a queried statistic.
You are a helpful assistant. If you do not know the answer to the question, provide your best estimate. Think carefully before giving an answer. Once you have the answer just state it like this. 'My final answer: {number}'.
⏰ When is this relevant?
A national restaurant chain wants to estimate how customers from different regions and lifestyle segments would react to a proposed switch to a fully digital loyalty program, replacing physical punch cards. The business wants to simulate survey responses from key persona groups (young urban professionals, suburban families, rural retirees) and compare the likely adoption rates and concerns for each.
🔢 Follow the Instructions:
1. Define the key audience personas: Choose 3–5 realistic segments based on real-world restaurant customer data. For example:
• Young urban professionals: 27, lives downtown, eats out 3x/week, tech-savvy, values convenience.
• Suburban family: 42, 2 kids, eats out on weekends, uses coupons, moderate tech user.
• Rural retiree: 68, lives in a small town, dines out monthly, prefers paper receipts, not confident with apps.
2. Prepare the prompt template for persona simulation: Use this template for each segment:
You are simulating a [persona description].
The restaurant chain is moving from physical punch cards to a fully digital loyalty program (app-based, requires smartphone registration).
You are taking a customer survey.
Answer honestly based on your persona, using 2–3 sentences for each question.
First question: How do you feel about the switch to a digital-only loyalty program?
3. Run the prompt for each persona through the AI model: For each persona group, generate 10–20 simulated survey responses. Slightly vary the phrasing, e.g., ""Would you be more or less likely to participate in the new program?"" or ""What concerns, if any, do you have about the digital system?""
4. Add a simple follow-up: Ask a second question such as, ""What would make you more comfortable or excited about using the digital loyalty app?"" or ""If you dislike the idea, what could change your mind?""
5. Tag and summarize responses: Quickly scan and label responses from each segment with tags like ""enthusiastic,"" ""concerned about privacy,"" ""technology barrier,"" or ""wants rewards to be easy to use."" Note any recurring themes or unique objections.
6. Compare across segments: Summarize which groups are most positive, which raise barriers, and what specific suggestions or worries arise. Look for actionable differences (e.g., urban professionals care about app features; retirees worry about accessibility).
🤔 What should I expect?
You’ll get a clear directional understanding of how different customer segments might respond to the digital loyalty switch, what pain points or motivators to address in communications, and which groups may need extra support or incentives. This allows you to refine rollout plans, messaging, and support resources before piloting with real customers.