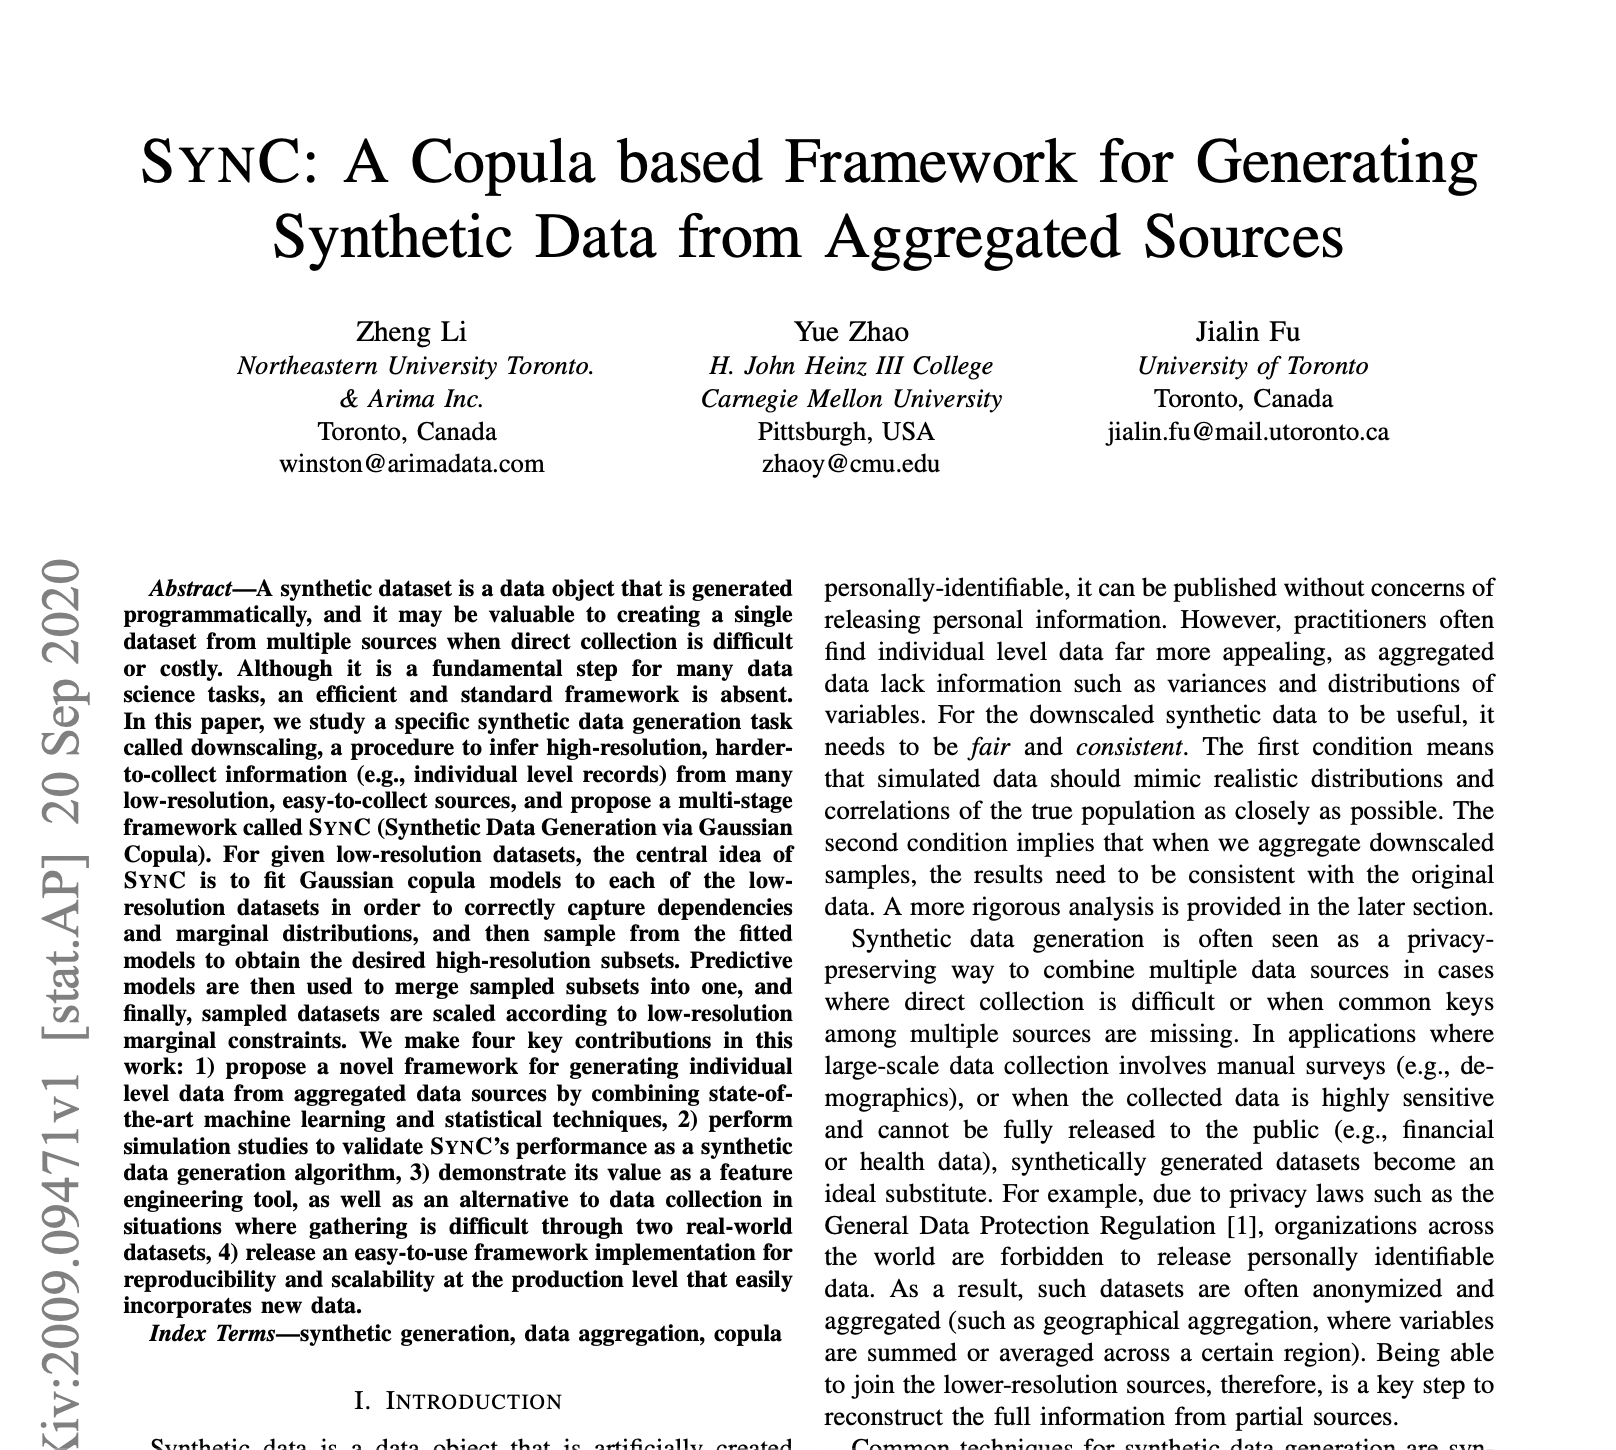
Sync: a Copula Based Framework for Generating Synthetic Data from Aggregated Sources
postZheng Li, Yue Zhao, Jialin Fu
Published: 2020-09-20
🔥 Key Takeaway:
The less specific you are about individual details and the more you anchor your synthetic audience in simple, real-world summary data, the more realistic—and actionable—your results become; in other words, broad, bland aggregates beat detailed, imaginative backstories when it comes to predicting what real people will actually do.
🔮 TLDR
This paper presents SYNC, a framework for generating individual-level synthetic data from aggregated datasets using a combination of machine learning and statistical methods, specifically Gaussian copula models. SYNC works in four main phases: outlier removal, modeling dependencies between features, predictive model fitting to merge data batches, and marginal scaling to ensure that the generated data matches the original aggregates. In tests using Canadian census and market research data, SYNC was able to reconstruct individual-level data from aggregated sources with 20–50% accuracy depending on group size and variable complexity, which is significantly better than random assignment (see results tables on pages 6-7). The synthetic data also improved the accuracy of downstream machine learning models by about 2.5–11% compared to using only the original data. Key takeaways: use copula-based techniques to capture realistic dependencies, remove outliers before generation, and batch features to manage high dimensionality. SYNC is particularly useful when only aggregated data is available due to privacy or cost constraints, and the authors provide open-source code for reproducibility.
📊 Cool Story, Needs a Graph
Figure
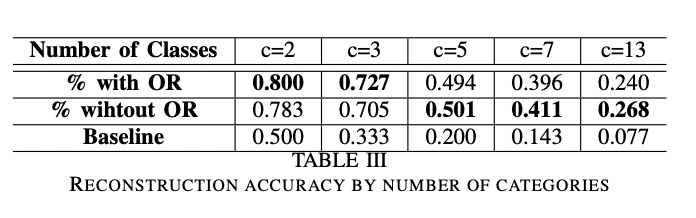
SYNC’s reconstruction accuracy is compared to random assignment across multiple variable types, with and without outlier removal.
Table III presents a clear side-by-side comparison of reconstruction accuracy for the SYNC method under two variants (with and without outlier removal) versus a random assignment baseline, across variables with 2, 3, 5, 7, and 13 categories. The grid allows the reader to quickly see how SYNC outperforms random assignment in all cases, how performance drops as the number of categories increases, and how outlier removal helps for simpler variables but has less impact for more complex ones. This comprehensive format enables direct assessment of the method’s advantage over a baseline and the effect of key options in a single view.
⚔️ The Operators Edge
One subtle but crucial detail in this study is the use of *marginal scaling* in the final phase of synthetic data generation. After simulating individual-level data from aggregates, the method doesn’t just trust the initial results—it actively forces the distribution of key variables in the synthetic sample to exactly match the observed proportions or averages in the original data. This is done by reassigning sampled values until the marginal totals line up, which is a level of post-processing rigor many synthetic data approaches skip.
Why it matters: This step ensures that, no matter how much randomness or model error slips into the simulation, the overall synthetic dataset cannot drift away from real-world constraints. It acts as a “reality anchor” that guarantees the synthetic audience reflects true market proportions—making findings more credible and actionable for business decisions. Without this, even sophisticated simulations risk accumulating subtle biases that undermine trust and applicability.
Example of use: Imagine a team simulating responses to a new product using AI personas generated from city-level sales data. By applying marginal scaling, they ensure that if 32% of the real market is first-time buyers, 32% of their synthetic sample will be too—no matter how the AI initially distributed those personas. Their simulated test results can then be reported as representative of the actual market structure, not just plausible individuals.
Example of misapplication: If a team generates AI personas and skips marginal scaling—just taking whatever the model outputs—they might end up with a synthetic dataset where a key group (like high-income customers) is over- or under-represented compared to the real market. Marketing strategies or product tweaks based on this “off-balance” audience could flop in reality, because the apparent insights were skewed by sampling noise, not true demand patterns.
🗺️ What are the Implications?
• Enhance survey-based studies with synthetic data to fill gaps: If your available data is limited or missing details, you can use synthetic data techniques to generate realistic, individual-level information that closely mimics real-world population patterns.
• Leverage existing aggregated data for richer insights: Even if you only have access to summary data (for example, averages or percentages by region), modern methods can “downscale” these figures to create detailed, lifelike personas for analysis and testing.
• Use outlier detection to improve simulation quality: Removing odd or extreme data points before running simulations leads to more accurate, consistent results—especially for simple, binary questions (as shown in reconstruction accuracy rates on page 6).
• Choose diverse and relevant variables rather than just more variables: The accuracy of synthetic populations drops as the number of response categories increases; focus on variables that matter most to your research question, not just those with the most detail.
• Augment your customer data for better prediction models: Adding synthetic features generated from census or market research data can boost the performance of your marketing or sales prediction models by 2.5–11% (Table IV on page 7), leading to more targeted and effective outreach.
• Validate synthetic results against small real samples: Before making big bets, check that your synthetic findings align with a limited set of real customer interviews or surveys. This reduces risk and increases confidence for business decision-makers.
• Document your data sources and assumptions: Clearly note where your synthetic population comes from and how it was built, so stakeholders can trust the credibility and relevance of your virtual audience results.
📄 Prompts
There were no role-play prompts in this paper.