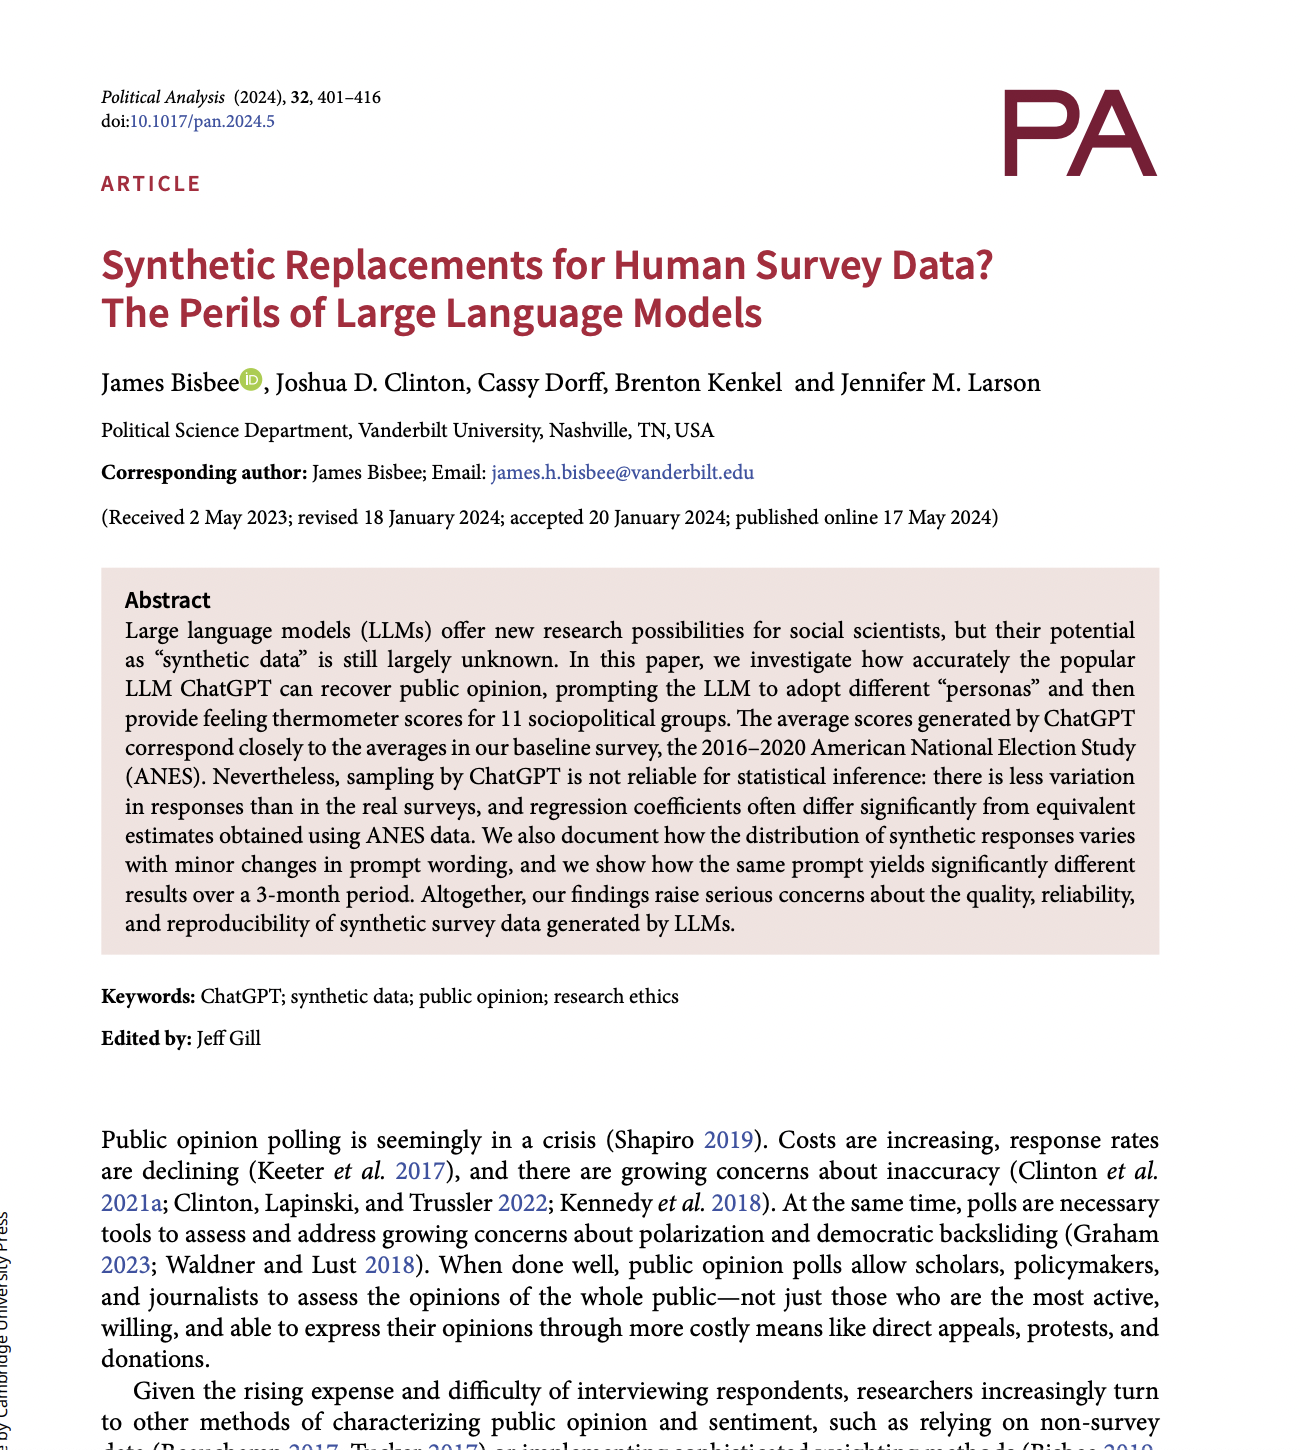
Synthetic Replacements for Human Survey Data? The Perils of Large Language Model?
postJames Bisbee, Joshua D. Clinton, Cassy Dorff, Brenton Kenkel, Jennifer M. Larson
Published: 2023-05-02
🔥 Key Takeaway:
The more you try to make AI personas match real-world groups using lots of demographic details, the less lifelike—and less useful—their answers become: the simulated audience gets more predictable, not more realistic, so your best guess may actually come from a blander, less “personalized” approach.
🔮 TLDR
This paper benchmarks ChatGPT 3.5 "personas" against real US survey data to test whether synthetic AI-based respondents can replace human survey samples for public opinion research. While ChatGPT's average scores for "feeling thermometer" questions about sociopolitical groups were close to real survey means and maintained rank order across groups, the synthetic data consistently showed much less variation than actual human responses and failed to reproduce the structure of demographic and attitudinal correlations found in the real data: 48% of regression coefficients from synthetic responses were statistically different from those from human data, with 32% flipping the sign of the effect. The synthetic results were also highly sensitive to small changes in prompt wording, the choice of political vs. demographic conditioning, and even varied significantly over time as the underlying model changed, undermining reproducibility. These findings show that while LLM personas can quickly approximate population-level averages, their lack of true response variability, unreliable subgroup estimates, and prompt/model sensitivity make them unsuited for drawing inferences about relationships, testing hypotheses, or replacing human samples for most market research or social science applications.
📊 Cool Story, Needs a Graph
Figure 3
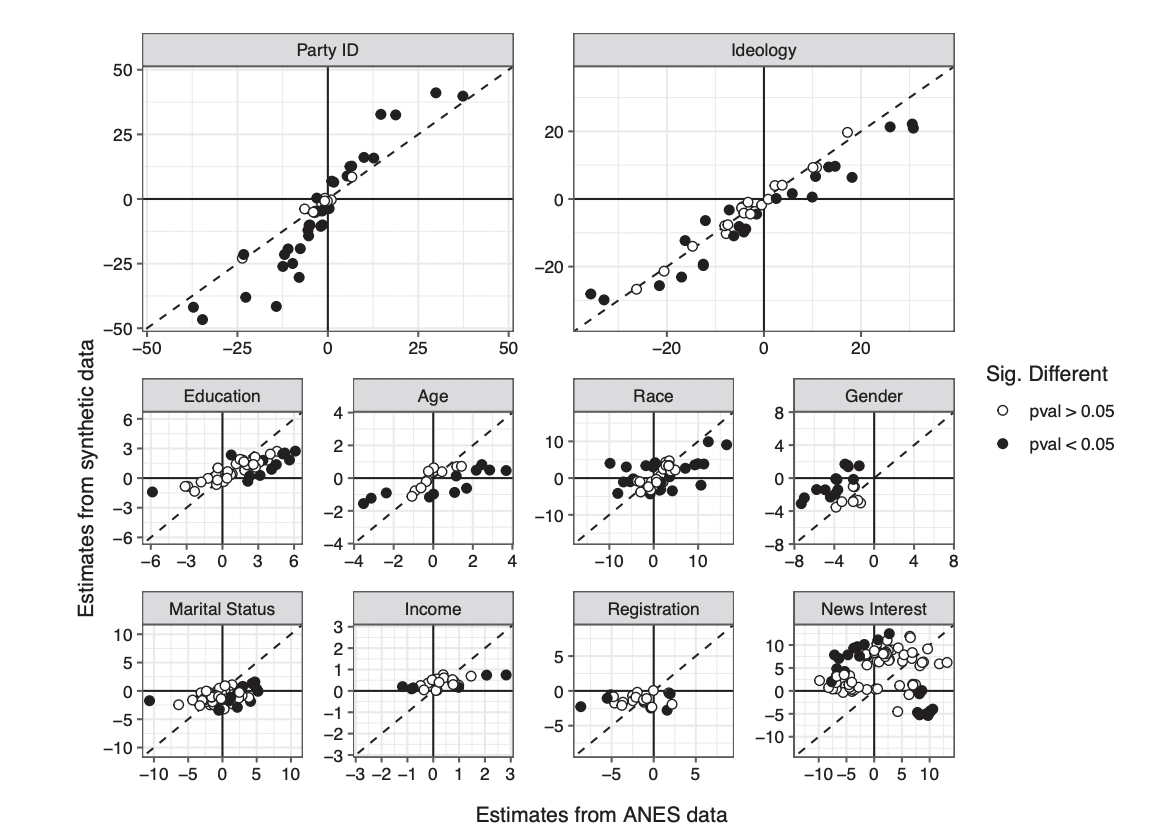
Side-by-side coefficient scatterplots reveal where LLM-derived synthetic data replicates—or fails to replicate—key demographic and attitudinal relationships found in real survey data.
Figure 3 presents a grid of scatterplots, one for each covariate of interest (e.g., Party ID, Ideology, Education, Age, Race, Gender, etc.), plotting the estimated regression coefficients from the real ANES survey (x-axis) against those from the synthetic LLM data (y-axis) across all target groups and years. Points on the 45-degree line indicate agreement between methods, while off-diagonal points—especially those in opposite quadrants—highlight sign reversals or substantial deviations. Solid points indicate statistically significant differences. This figure provides a comprehensive, at-a-glance assessment of the extent to which the synthetic approach mirrors or diverges from the baseline across all key relationships, making it the most compelling head-to-head visual benchmark in the paper.
⚔️ The Operators Edge
A subtle but powerful insight from the study is that *prompt engineering techniques dramatically improve when exemplar prompts match the statistical and stylistic patterns of the model’s pretraining corpus*—a phenomenon that emerges clearly in their discussion of **Prompt Mining** and **Exemplar Format** (Section 2.2.1.2 and 2.2.1.1). In plain terms: prompts that "look like" data the model has seen during training are far more likely to yield accurate and stable results. This isn't just about prompt content—it’s about the *form*, the phrasing, and even the punctuation matching learned distributions. The LLM is effectively pattern-matching on prompt structure, not just semantics.
Why it matters: Most experts focus on the informational content of a prompt—what you’re asking—but this study shows that matching the *surface structure* of prompts to what the model is familiar with from pretraining can have outsized effects. It explains why seemingly minor differences in prompt wording or formatting (e.g., “Q: A:” vs. natural phrasing) can cause large performance swings. This is a hidden lever because it’s easy to overlook as trivial, yet deeply tied to how LLMs internally parse and prioritize input patterns.
Example of use: Suppose you're building an AI to assist radiologists in labeling medical reports as “benign” or “concerning.” Rather than prompting the model with "Does this report suggest a medical concern? {TEXT}," you mine the pretraining corpus or similar datasets (e.g., PubMed abstracts) to find how classification or annotation is usually phrased. You might discover that prompts like “Assessment: {TEXT} Impression:” or “Findings: {TEXT} Diagnosis:” yield higher performance because they align with learned medical report structures. By mimicking corpus style, you're not teaching the model a new task—you're helping it recognize a familiar one.
Example of misapplication: A product team develops a customer sentiment classifier using GPT-4 and manually writes few-shot prompts in a clean, instructional format: “Please label the following text as ‘positive’ or ‘negative.’” But the exemplars don't reflect typical internet language or social media formatting. Worse, they include polite, verbose phrasing absent in the training corpus. The model underperforms, not because it lacks ability, but because the prompt’s surface form is out-of-distribution. Had they matched the slangy, compact, emoji-rich style of actual tweets—mirroring what the model saw during pretraining—the results would’ve been more reliable and consistent.
🗺️ What are the Implications?
• Don’t rely on synthetic audiences for subgroup insights or causal patterns: The study found that nearly half of all demographic or attitudinal relationships (e.g., how gender, race, or ideology predict choices) were statistically different when simulated with AI personas versus real people, and about a third actually reversed direction—so use caution if you want to understand why different groups behave the way they do.
• Use AI-generated survey data for quick pulse checks, not deep analytics: While simulated responses from language models were close to real averages at the top-line level, they lacked the genuine variation seen in real surveys and couldn’t reliably predict which factors drive opinions, making them best for rough directional reads, not for investment or go/no-go decisions.
• Test and lock your prompt wording before running simulations at scale: Small changes in how questions or personas are described can lead to big swings in results, so decide on and pilot your prompt design up front—don’t tweak mid-study, or your results won’t be consistent or reliable.
• Repeat simulations to check for stability over time: The same AI prompt can give different answers on different days or after model updates, which means findings may not be reproducible later—rerun your study at least twice to spot shifts before acting on the results.
• Validate simulated findings with at least a small real-world sample: Because synthetic data can misrepresent group differences or the strength of trends, always plan to run a quick, targeted real-world check (even if small) before making major bets or public claims based on AI-only research.
• Document your methodology and versioning for transparency: Since AI models and prompts evolve, always record exactly what prompt was used and which version of the AI generated your data, so you or others can interpret, revisit, or try to replicate the results in the future.
• Don’t treat AI personas as a replacement for real customers: For now, the best use of synthetic audiences is as a supplement to, not a substitute for, traditional research—use them to brainstorm, pressure-test ideas, or fill in gaps, but keep real-world validation in your process.
📄 Prompts
Prompt Explanation: The AI was prompted to adopt a detailed respondent persona based on actual survey respondent characteristics and then answer a battery of feeling thermometer questions about social and political groups, formatting responses in a specified table structure.
It is [YEAR]. You are a [AGE] year-old, [MARST], [RACETH][GENDER]with [EDUCATION] making [INCOME] per year, living in the United States. You are [IDEO], [REGIS][PID] who [INTEREST] pays attention to what’s going on in government and politics.

Provide responses from this person’s perspective. Use only knowledge about politics that they would have. Format the output as a tsv table with the following format:
group,thermometer,explanation,confidence
The following questions ask about individuals’ feelings toward different groups. Responses should be given on a scale from 0 (meaning cold feelings) to 100 (meaning warm feelings). Ratings between 50 degrees and 100 degrees mean that you feel favorable and warm toward the group. Ratings between 0 degrees and 50 degrees mean that you don’t feel favorable toward the group and that you don’t care too much for that group. You would rate the group at the 50 degree mark if you don’t feel particularly warm or cold toward the group.
How do you feel toward the following groups?
The Democratic Party?
The Republican Party?
Democrats?
Republicans?
Black Americans?
White Americans?
Hispanic Americans?
Asian Americans?
Muslims?
Christians?
Immigrants?
Gays and Lesbians?
Jews?
Liberals?
Conservatives?
Women?
Prompt Explanation: The AI was instructed to adopt respondent personas using only demographic characteristics, political characteristics, or both in distinct prompt formulations, in order to test the sensitivity of outputs to the information provided in the persona description.
Demographics only: “It is [YEAR]. You are a [AGE] year-old [MARST][RACETH][GENDER] with [EDUCATION] making [INCOME] per year, living in the United States.”

Politics only: “It is [YEAR]. You are [IDEO], [REGIS][PID] who [INTEREST] pays attention to what’s going on in government and politics, living in the United States.”

Combined: “It is [YEAR]. You are a [AGE] year-old, [MARST], [RACETH][GENDER] with [EDUCATION] making [INCOME] per year, living in the United States. You are [IDEO], [REGIS][PID] who [INTEREST] pays attention to what’s going on in government and politics.”
⏰ When is this relevant?
A financial services company wants to test customer reactions to a new rewards-based credit card with three different feature bundles (travel perks, cashback, and low interest rates). They want to use AI personas to simulate quantitative "likelihood to apply" ratings and qualitative feedback across three key target segments: young professionals, value-seeking families, and high-income frequent travelers. The goal is to identify which features resonate with each group and spot any unexpected objections or motivators.
🔢 Follow the Instructions:
1. Define target audience segments: Write a simple profile for each segment that includes age range, income, lifestyle, and financial priorities. Example:
• Young professional: 27, single, urban, $60k salary, values flexibility and digital rewards.
• Value-seeking family: 42, married with two kids, suburban, $90k household income, wants savings and family-friendly perks.
• High-income traveler: 38, executive, $180k+, travels internationally, seeks premium perks and status.
2. Prepare the prompt template for AI personas: For each segment, use this template:
You are simulating a [persona description].
Here is the new credit card being tested: ""[Insert product bundle description here]""
Please rate, on a scale from 0 (not at all likely) to 100 (extremely likely), how likely you would be to apply for this card based on your needs and lifestyle. Then, briefly explain your reasoning in 2–3 sentences, focusing on what appeals to you and what might hold you back.
3. Run the prompt for each feature bundle and persona: For each of the three audience segments, run the above prompt for each feature bundle (travel perks, cashback, low interest). For broader perspective, generate 5–10 responses per segment-bundle pair, varying the wording slightly (""What stands out most about the offer?"" or ""How does this card compare to your current card?"").
4. Organize and score the responses: Collect the numeric ratings and qualitative explanations. Tag key themes in each explanation, such as ""mentions annual fee,"" ""likes travel perks,"" ""concerned about interest rate,"" ""values cashback,"" or ""mentions family benefits.""
5. Compare and summarize by segment: For each segment, average the numeric likelihood ratings for each bundle. Summarize which features or drawbacks are mentioned most frequently in the explanations. Look for patterns—such as high-income travelers valuing perks even at higher annual fees, or families focusing on practical benefits.
6. Optional: Probe for objections or dealbreakers: For each segment and bundle, add a follow-up prompt:
What, if anything, would stop you from applying for this card? Is there a feature or term that would make you reconsider?
🤔 What should I expect?
You'll get a clear, directional view of which card features are most and least attractive to different customer segments, backed by both quantified intent scores and authentic-sounding feedback. This allows the team to focus product messaging, identify points of friction, and prioritize bundles for further real-world testing or development.